The function adds a 'markers' feature variable. These markers are
read from a comma separated values (csv) spreadsheet file. This
markers file is expected to have 2 columns (others are ignored)
where the first is the name of the marker features and the second
the group label. Alternatively, a markers named vector as provided
by the pRolocmarkers function can also be used.
Arguments
- object
An instance of class
MSnSet.- markers
A
characterwith the name the markers' csv file or a named character of markers as provided bypRolocmarkers.- mcol
A
characterof length 1 defining the feature variable label for the newly added markers. Default is"markers".- fcol
An optional feature variable to be used to match against the markers. If missing, the feature names are used.
- verbose
A
logicalindicating if number of markers and marker table should be printed to the console.
Details
It is essential to assure that featureNames(object) (or
fcol, see below) and marker names (first column) match,
i.e. the same feature identifiers and case fold are used.
See also
See pRolocmarkers for a list of spatial
markers and markers for details about markers
encoding.
Examples
library("pRolocdata")
data(dunkley2006)
atha <- pRolocmarkers("atha")
try(addMarkers(dunkley2006, atha)) ## markers already exists
#> Error in addMarkers(dunkley2006, atha) :
#> Detected an existing 'markers' feature column.
fData(dunkley2006)$markers.org <- fData(dunkley2006)$markers
fData(dunkley2006)$markers <- NULL
marked <- addMarkers(dunkley2006, atha)
#> Markers in data: 255 out of 689
#> organelleMarkers
#> ER ER Lumen ER Membrane Envelope Golgi
#> 21 9 42 3 27
#> Mitochondrion PM Plastid Ribosome STR
#> 50 42 22 8 2
#> TGN Vacuole unknown
#> 13 16 434
fvarLabels(marked)
#> [1] "assigned" "evidence" "method" "new" "pd.2013"
#> [6] "pd.markers" "markers.orig" "markers.org" "markers"
## if 'makers' already exists
marked <- addMarkers(marked, atha, mcol = "markers2")
#> Markers in data: 255 out of 689
#> organelleMarkers
#> ER ER Lumen ER Membrane Envelope Golgi
#> 21 9 42 3 27
#> Mitochondrion PM Plastid Ribosome STR
#> 50 42 22 8 2
#> TGN Vacuole unknown
#> 13 16 434
fvarLabels(marked)
#> [1] "assigned" "evidence" "method" "new" "pd.2013"
#> [6] "pd.markers" "markers.orig" "markers.org" "markers" "markers2"
stopifnot(all.equal(fData(marked)$markers, fData(marked)$markers2))
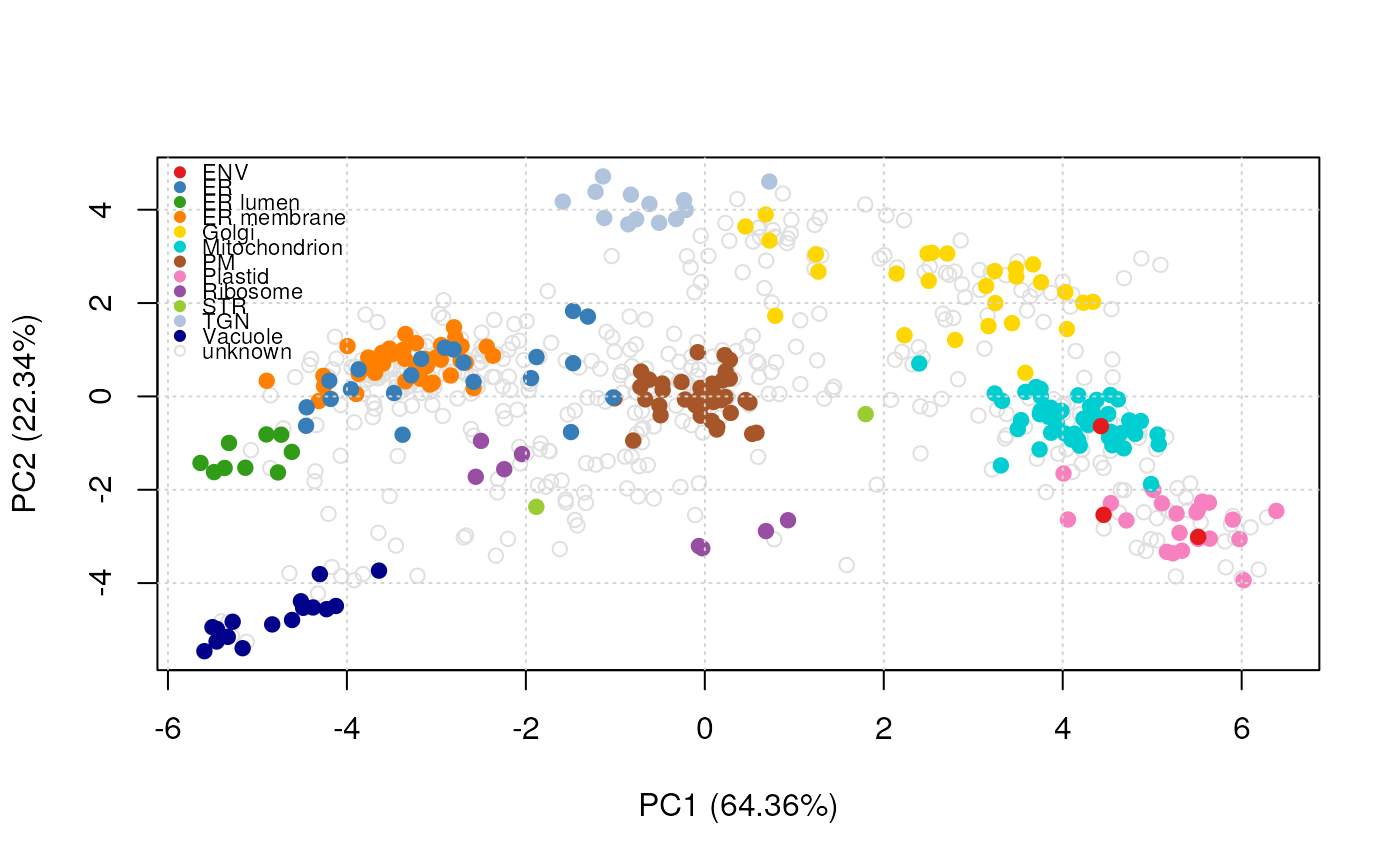
plot2D(marked)
addLegend(marked, where = "topleft", cex = .7)