class: center, middle, inverse, title-slide # Mass spectrometry-based proteomics ### <a href="#laurent-gatto">Laurent Gatto</a> ### <a href="http://www-huber.embl.de/csama2018/">CSAMA</a>, Brixen, 12 July 2018 --- class: middle name: cc-by ### Get the slides at http://bit.ly/20180712csama These slides are available under a **creative common [CC-BY license](http://creativecommons.org/licenses/by/4.0/)**. You are free to share (copy and redistribute the material in any medium or format) and adapt (remix, transform, and build upon the material) for any purpose, even commercially <img height="20px" alt="CC-BY" src="./img/cc1.jpg" />. --- class: middle center  ??? From a 2011 study that compared the expression profiles of 3 cell lines using RNA-Seq, MS-based proteomics and immunofluorescence (protein-specific antibodies). They observed an overall Spearman correlation of 0.63. **In what ways to these summaries differ?** Using a common gene-centric identifier, but - What do we have along the rows, what are our features? Transcripts on the left. Protein groups on the right. - How are these intensities produced? ## Take-home message 1 These data tables are less similar than they appear. --- class: middle ### Overview 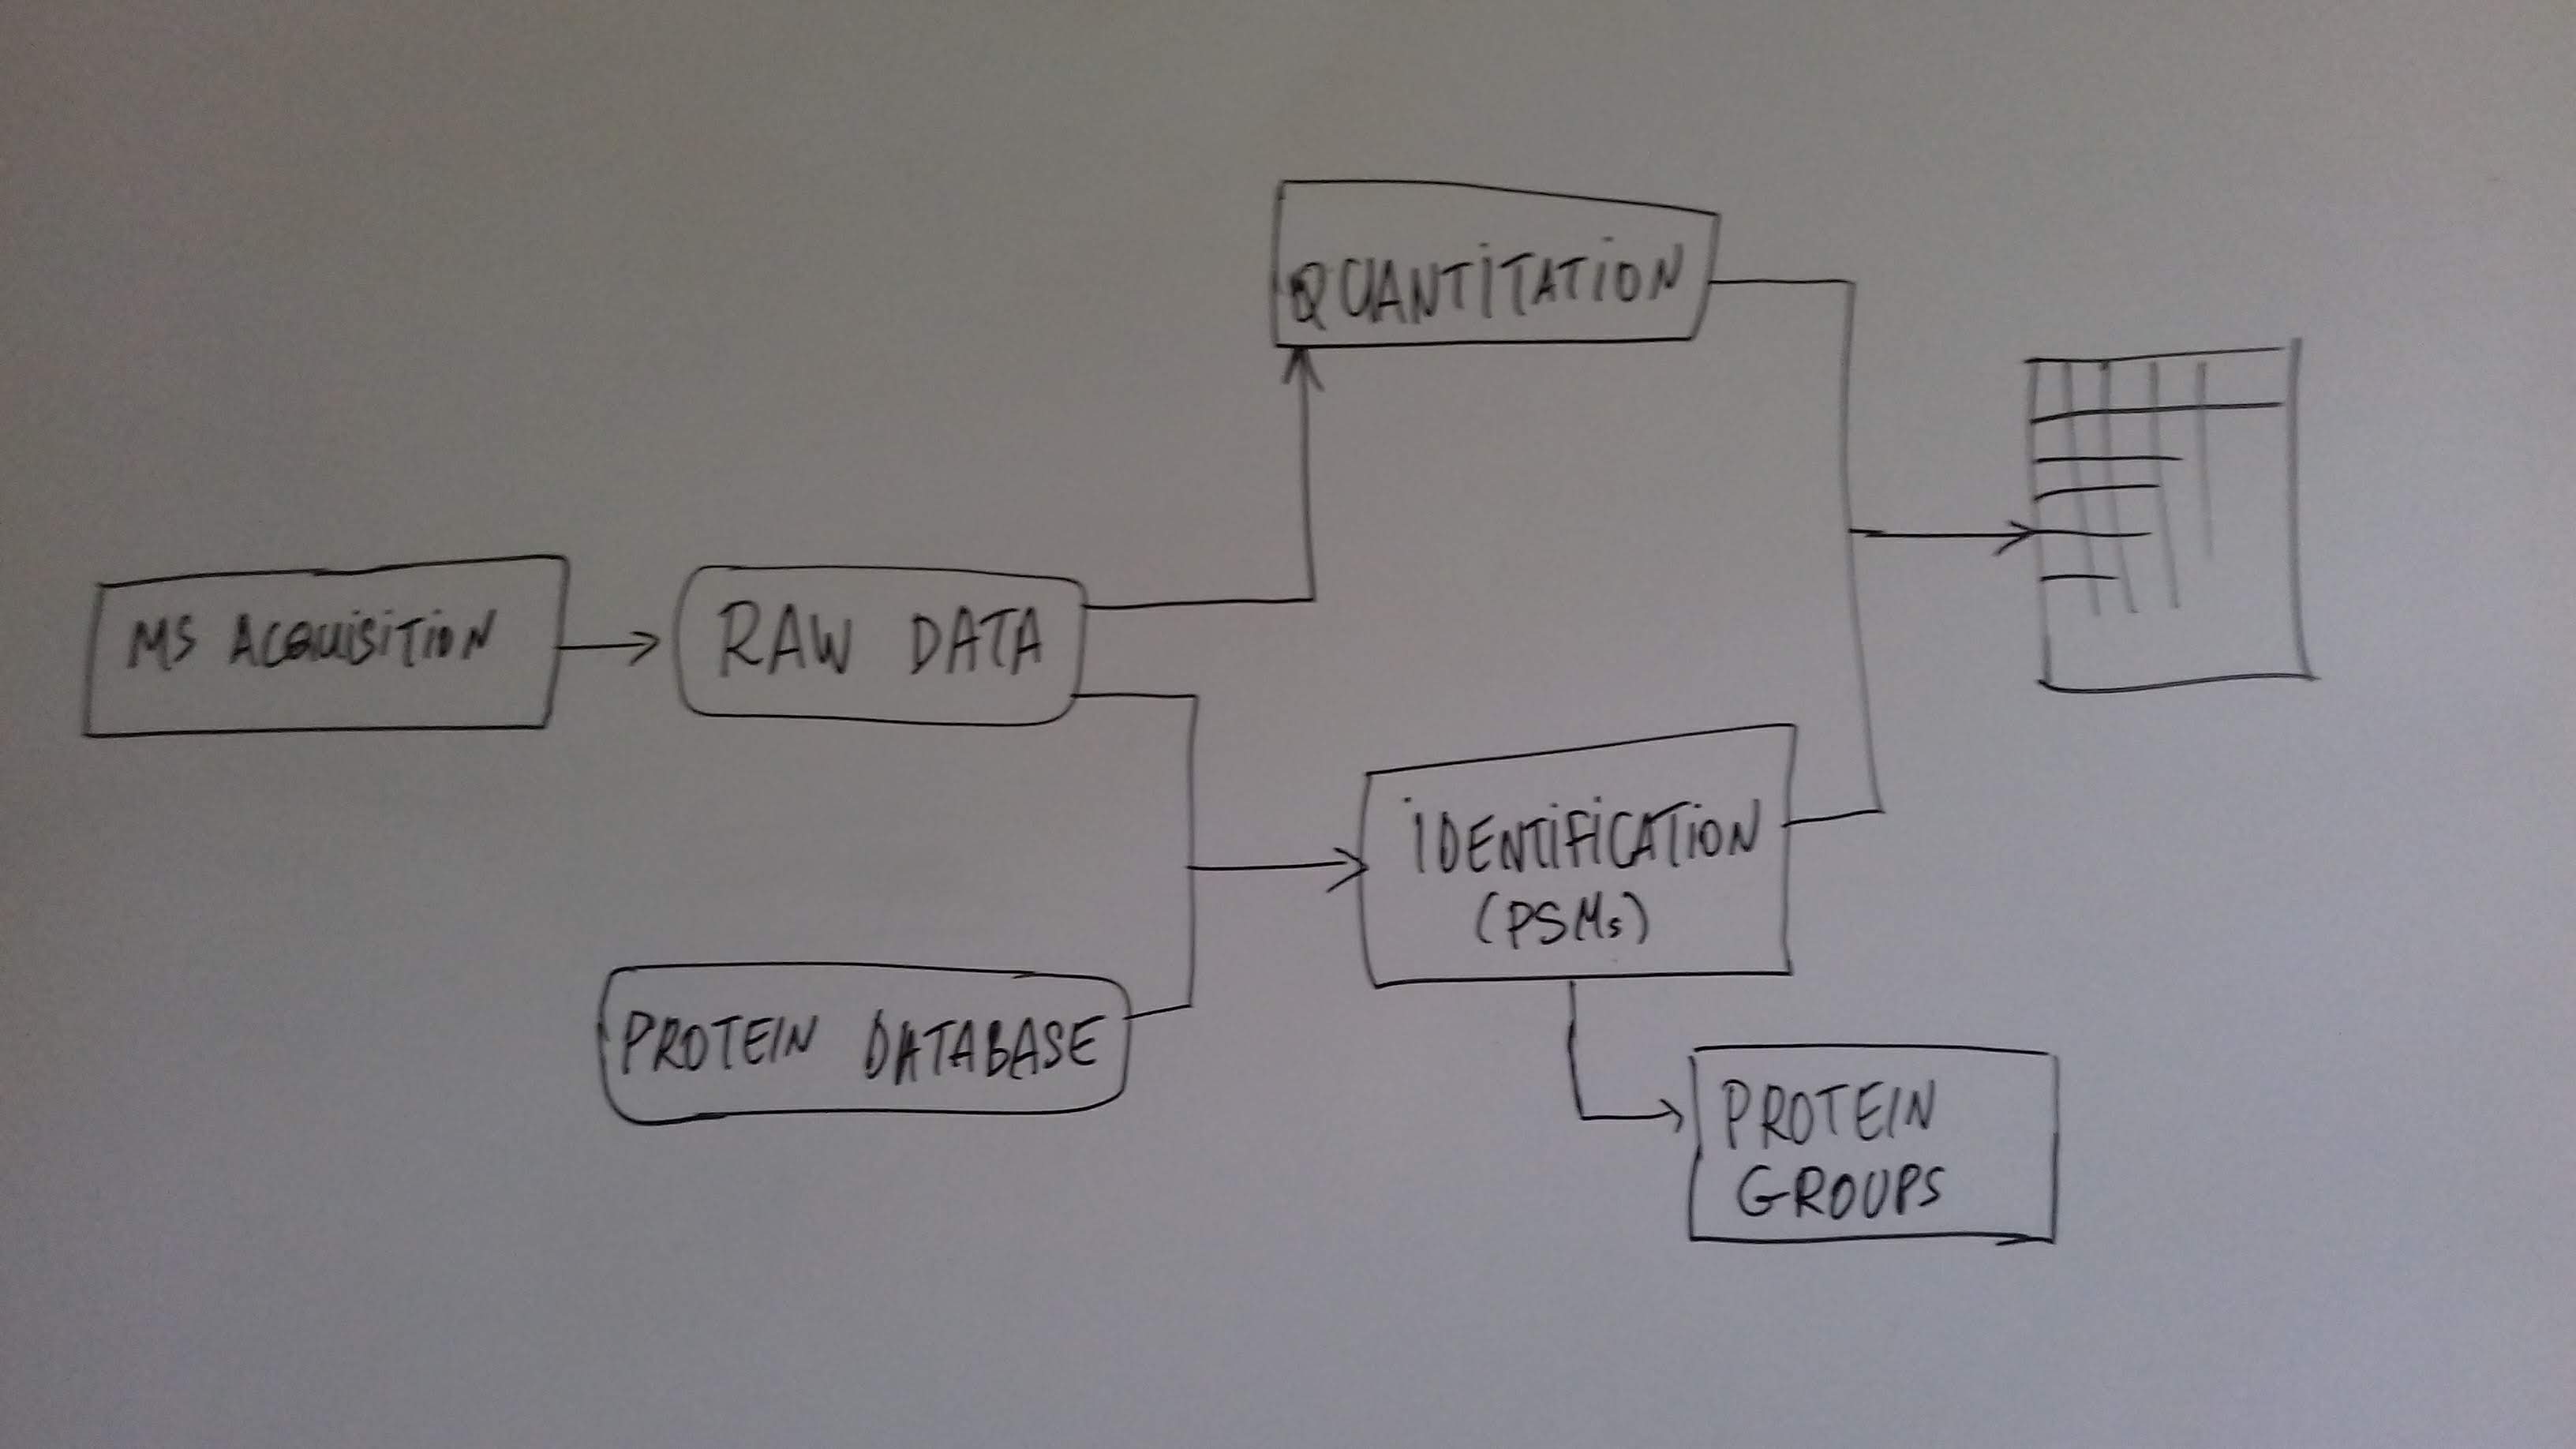 --- class: middle ### Overview 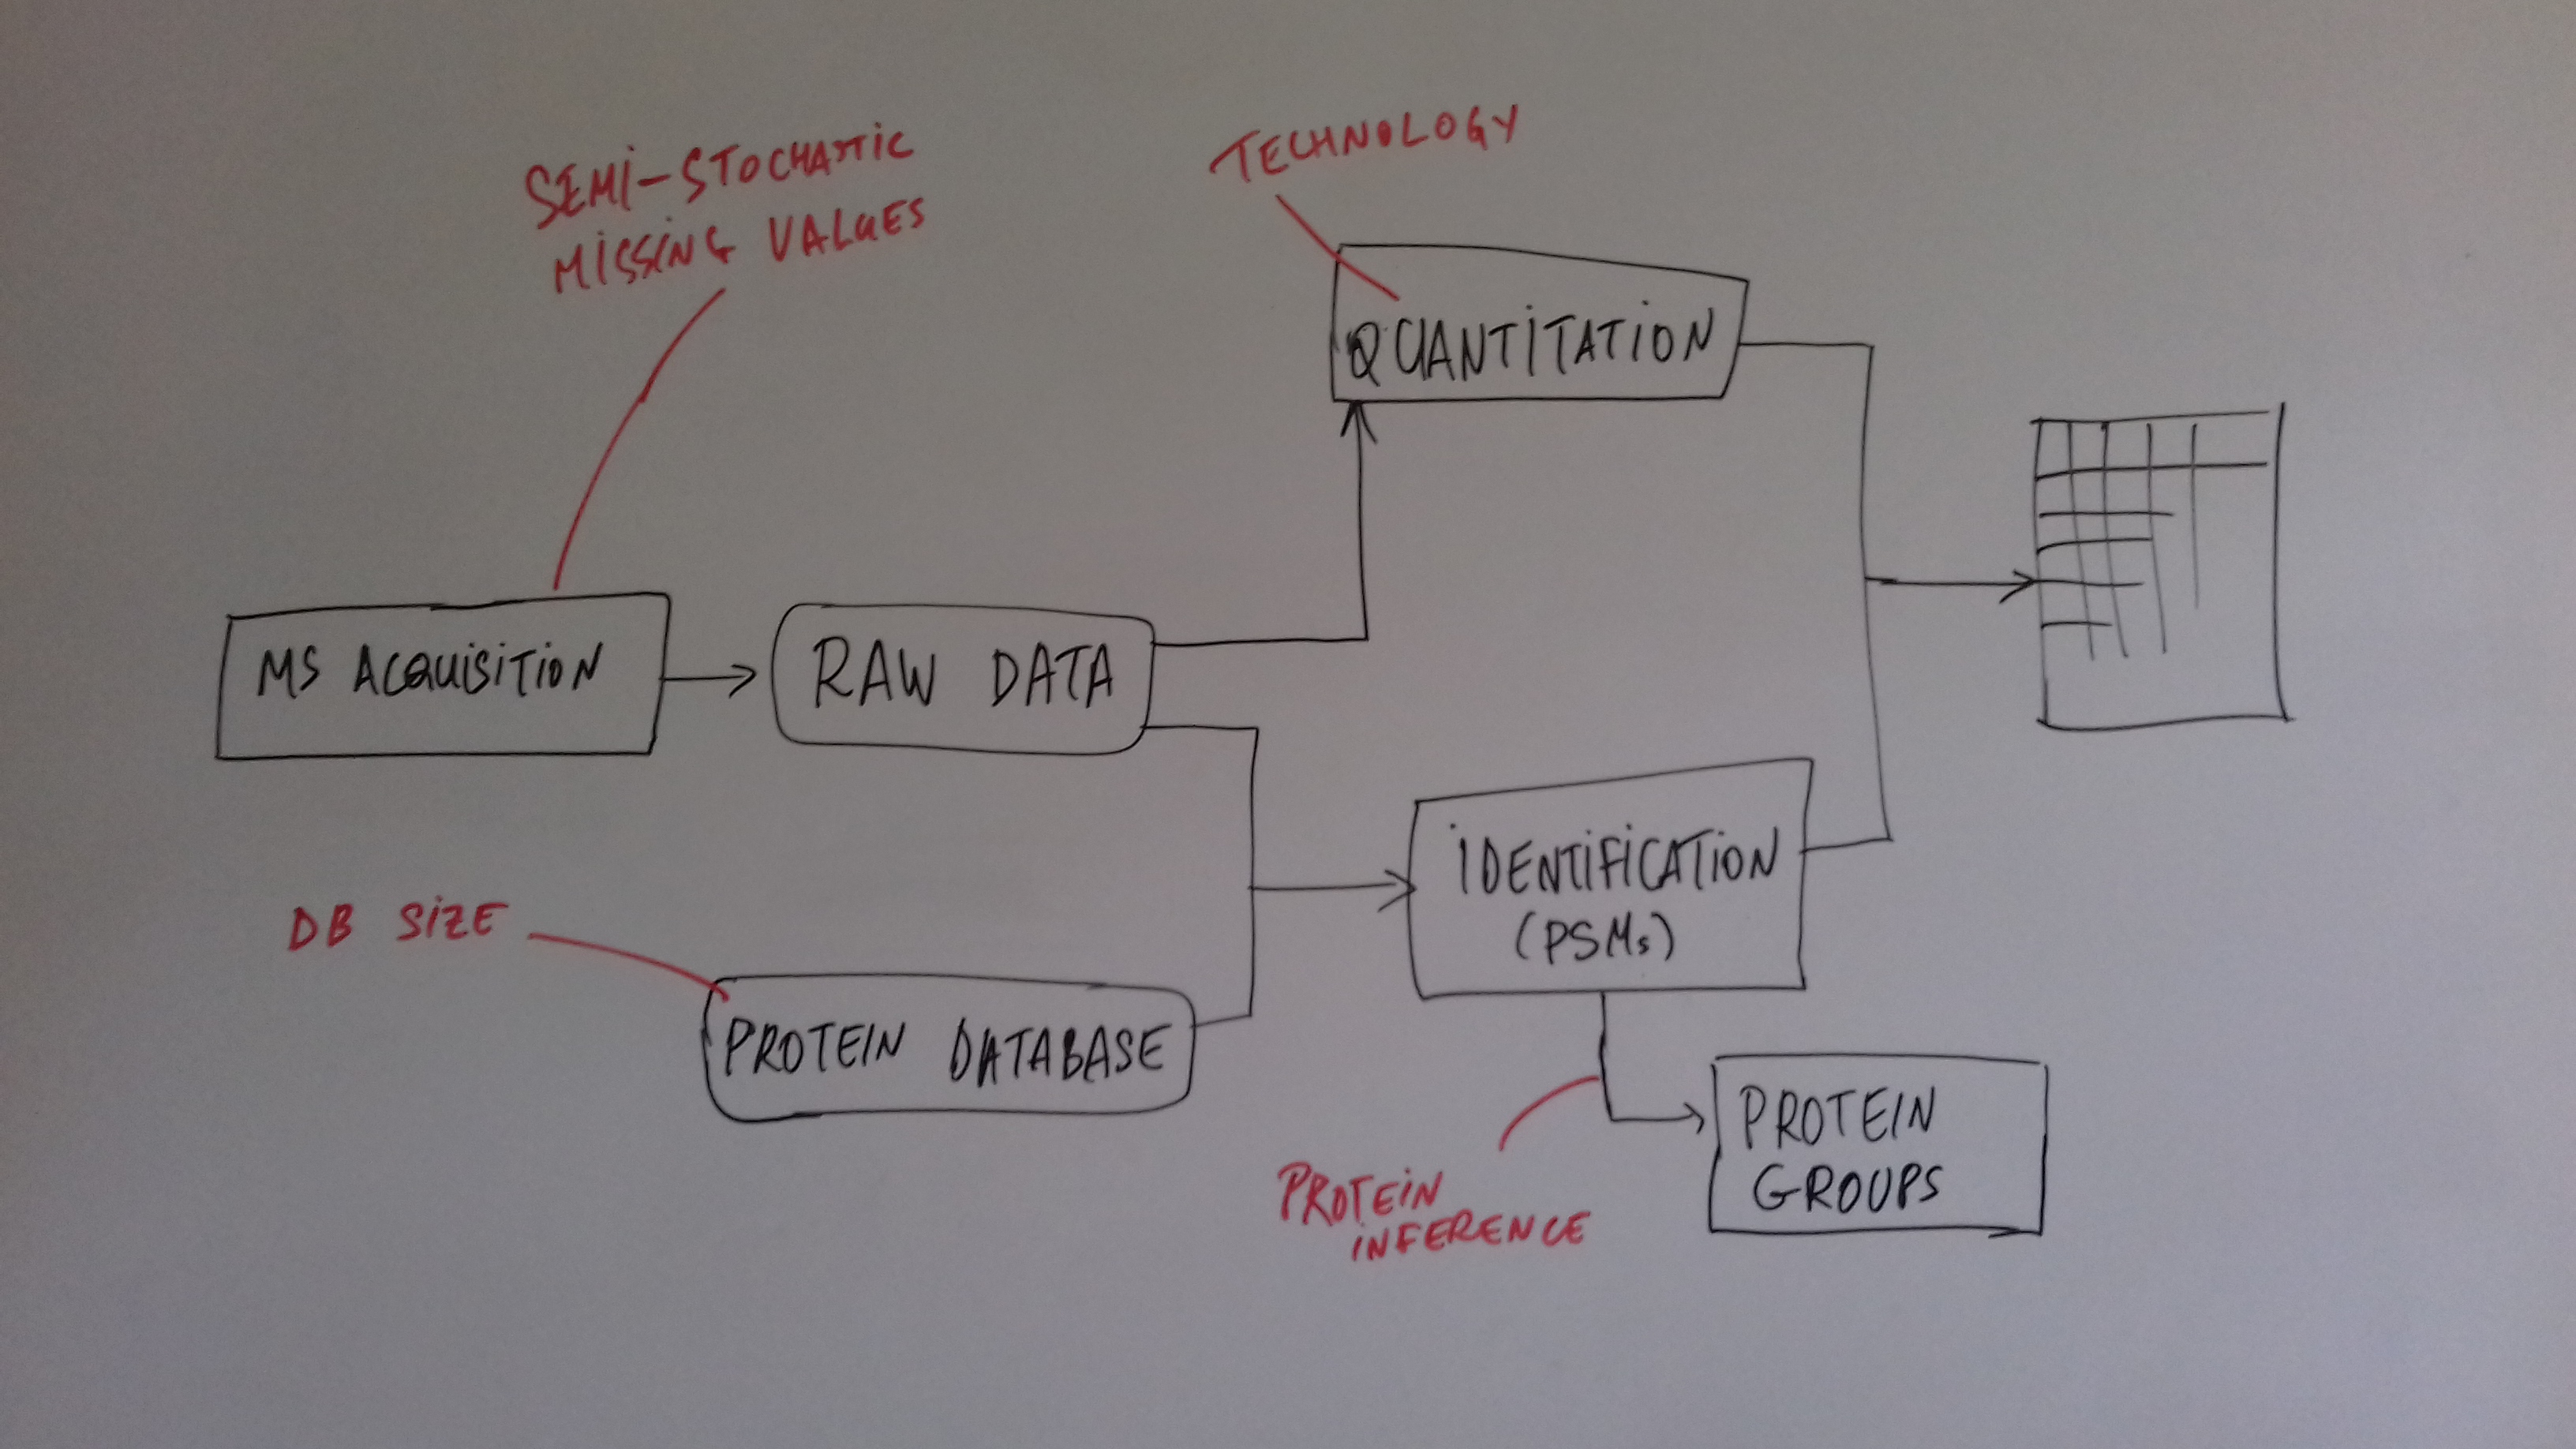 --- ### How does MS work? 1. Digestion of proteins into peptides - as will become clear later, the features we measure in shotgun (or bottom-up) *proteomics* are peptides, **not** proteins. -- 2. On-line liquid chromatography (LC-MS) -- 3. Mass spectrometry (MS) is a technology that **separates** charged molecules (ions, peptides) based on their mass to charge ratio (M/Z). --- ### Chromatography MS is generally coupled to chromatography (liquid LC, but can also be gas-based GC). The time an analytes takes to elute from the chromatography column is the **retention time**.  ??? - This is an acquisition. There can be one per sample (with muliple fractions), of samples can be combined/multiplexed and acquired together. --- class: middle An mass spectrometer is composed of three components: 1. The *source*, that ionises the molecules: examples are Matrix-assisted laser desorption/ionisation (MALDI) or electrospray ionisation (ESI). 2. The *analyser*, that separates the ions: Time of flight (TOF) or Orbitrap. 3. The *detector* that quantifies the ions. Ions typically go through that cylce at least twice (MS2, tandem MS, or MSMS). Before the second cycle, individual *precursor* ions a selected and broken into *fragment* ions. --- class: middle center 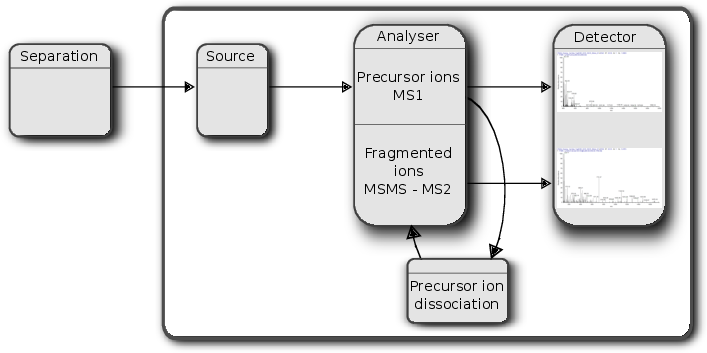 ??? Before MS: - Restriction with enzyme, typically trypsine. - Off-line fractionation. An mass spectrometer is composed of three components: 1. The *source*, that ionises the molecules: examples are Matrix-assisted laser desorption/ionisation (MALDI) or electrospray ionisation (ESI). 2. The *analyser*, that separates the ions: Time of flight (TOF) or Orbitrap. 3. The *detector* that quantifies the ions. Ions typically go through that cylce at least twice (MS2, tandem MS or MSMS). Before the second cycle, individual *precursor* ions a selected, broken into fragment ions. --- class: middle center  --- class: middle center  ??? Highlight - Semi-stochastic nature of MS - Data dependent acquisition (DDA) --- class: middle center .left-col-50[  ] .right-col-50[  ] ??? - Please keep this MS space and the semi-stochastic nature of MS acquisition in mind , as I will come back to it later. --- ### Identification: fragment ions  --- ### Identification: Peptide-spectrum matching (PSM) Matching **expected** and *observed* spectra: ``` > MSnbase::calculateFragments("SIGFEGDSIGR") mz ion type pos z seq 1 88.03931 b1 b 1 1 S 2 201.12337 b2 b 2 1 SI 3 258.14483 b3 b 3 1 SIG 4 405.21324 b4 b 4 1 SIGF 5 534.25583 b5 b 5 1 SIGFE 6 591.27729 b6 b 6 1 SIGFEG 7 706.30423 b7 b 7 1 SIGFEGD 8 793.33626 b8 b 8 1 SIGFEGDS 9 906.42032 b9 b 9 1 SIGFEGDSI 10 963.44178 b10 b 10 1 SIGFEGDSIG 11 175.11895 y1 y 1 1 R 12 232.14041 y2 y 2 1 GR 13 345.22447 y3 y 3 1 IGR 14 432.25650 y4 y 4 1 SIGR 15 547.28344 y5 y 5 1 DSIGR 16 604.30490 y6 y 6 1 GDSIGR [ reached getOption("max.print") -- omitted 16 rows ] ``` --- class: middle ### Identification: Peptide-spectrum matching (PSM) Matching *expected* and **observed** spectra:  ??? Performed by **search engines** such as Mascot, MSGF+, Andromeda, ... --- ### Identification: database  ??? ## [Human proteome](https://www.uniprot.org/help/human_proteome) In 2008, a draft of the complete human proteome was released from UniProtKB/Swiss-Prot: the approximately 20,000 putative human protein-coding genes were represented by one UniProtKB/Swiss-Prot entry, tagged with the keyword 'Complete proteome' and later linked to proteome identifier UP000005640. This UniProtKB/Swiss-Prot H. sapiens proteome (manually reviewed) can be considered as complete in the sense that it contains one representative (**canonical**) sequence for each currently known human gene. Close to 40% of these 20,000 entries contain manually annotated alternative isoforms representing over 22,000 additional sequences ## [What is the canonical sequence?](https://www.uniprot.org/help/canonical_and_isoforms) To reduce redundancy, the UniProtKB/Swiss-Prot policy is to describe all the protein products encoded by one gene in a given species in a single entry. We choose for each entry a canonical sequence based on at least one of the following criteria: 1. It is the most prevalent. 2. It is the most similar to orthologous sequences found in other species. 3. By virtue of its length or amino acid composition, it allows the clearest description of domains, isoforms, polymorphisms, post-translational modifications, etc. 4. In the absence of any information, we choose the longest sequence. ## Are all isoforms described in one UniProtKB/Swiss-Prot entry? Whenever possible, all the protein products encoded by one gene in a given species are described in a single UniProtKB/Swiss-Prot entry, including isoforms generated by alternative splicing, alternative promoter usage, and alternative translation initiation (*). However, some alternative splicing isoforms derived from the same gene share only a few exons, if any at all, the same for some 'trans-splicing' events. In these cases, the divergence is obviously too important to merge all protein sequences into a single entry and the isoforms have to be described in separate 'external' entries. ## UniProt [downloads](https://www.uniprot.org/downloads) --- class: middle ### Identification  From Käll *et al.* [Posterior Error Probabilities and False Discovery Rates: Two Sides of the Same Coin](https://pubs.acs.org/doi/abs/10.1021/pr700739d). ??? - (global) FDR = B/(A+B) - (local) fdr = PEP = b/(a+b) --- ### Identification: Protein inference - Keep only reliable peptides - From these peptides, infer proteins - If proteins can't be resolved due to shared peptides, merge them into **protein groups** of indistinguishable or non-differentiable proteins. --- class: middle  From [Qeli and Ahrens (2010)](http://www.ncbi.nlm.nih.gov/pubmed/20622826). --- class: middle  From [Nesvizhskii and Aebersold (2005)](http://www.ncbi.nlm.nih.gov/pubmed/16009968). ??? Basic peptide grouping scenarios. - a. distinct protein identifications. - b. differentiable protein identifications. - c. indistinguishable protein identifications. - d. subset protein identification. - e. subsumable protein identification. - f. an example of a protein group where one protein can explain all observed peptides, but its identification is not conclusive. --- class: middle ### Quantitation | |Label-free |Labelled | |:---|:----------|:----------| |MS1 |XIC |SILAC, 15N | |MS2 |Counting |iTRAQ, TMT | --- class: middle center ### Label-free MS2: Spectral counting  From the [Pbase](https://bioconductor.org/packages/release/bioc/html/Pbase.html) package. ??? Comments of **spectral counting**: - easy, but *semi-quantitative* - **Note depth/coverage and compare to RNA-seq.** --- class: middle center ### Labelled MS2: Isobaric tagging  ??? Comments of **isobaric tagging**: - multiplexing, albeit limited - limited problem with missing values - easy to process (fewer parameters to set) --- class: middle center ### Label-free MS1: extracted ion chromatograms  Credit: [Johannes Rainer](https://github.com/jotsetung/) ??? Comments on **label-free**: - Data processing - Independent runs, NAs --- class: middle center ### Labelled MS1: SILAC  Credit: Wikimedia Commons. ??? Comments of **isotope labelling**: - like red/green microarrays - can be extended to 3, but risk of overlap of light, medium and heavy peaks --- class: middle ### Quantitation | |Label-free |Labelled | |:---|:----------|:----------| |MS1 |XIC |SILAC, 15N | |MS2 |Counting |iTRAQ, TMT | - Labelled methods allow to pool samples before MS acquisition (up to 10 samples for Tandem Mass Tags (TMT)), rather than running individual MS runs for each samples, and thus sharing technical variability and reducing missing data (see for example Russel and Lilley [Pipeline to assess the greatest source of technical variance in quantitative proteomics using metabolic labelling](https://www.sciencedirect.com/science/article/pii/S1874391912006641)). - Summarising spectrum/peptide intensities into the protein (group) level quantities. ??? - Isobaric tagging (TMT, iTRAQ) are combined at the peptide level, i.e. after labelling. - Metabolic labelling (SILAC, 15N, 18O) are combined at the protein level, thus sharing some additional technical variability. --- class: middle ### Dealing with missing values Really missing, or not detected (semi-stochastic nature of precursor selection in shotgun proteomics)? - Identifiction transfer/matching between runs. - Filtering. - Imputation. --- class: middle .left-col-50[ 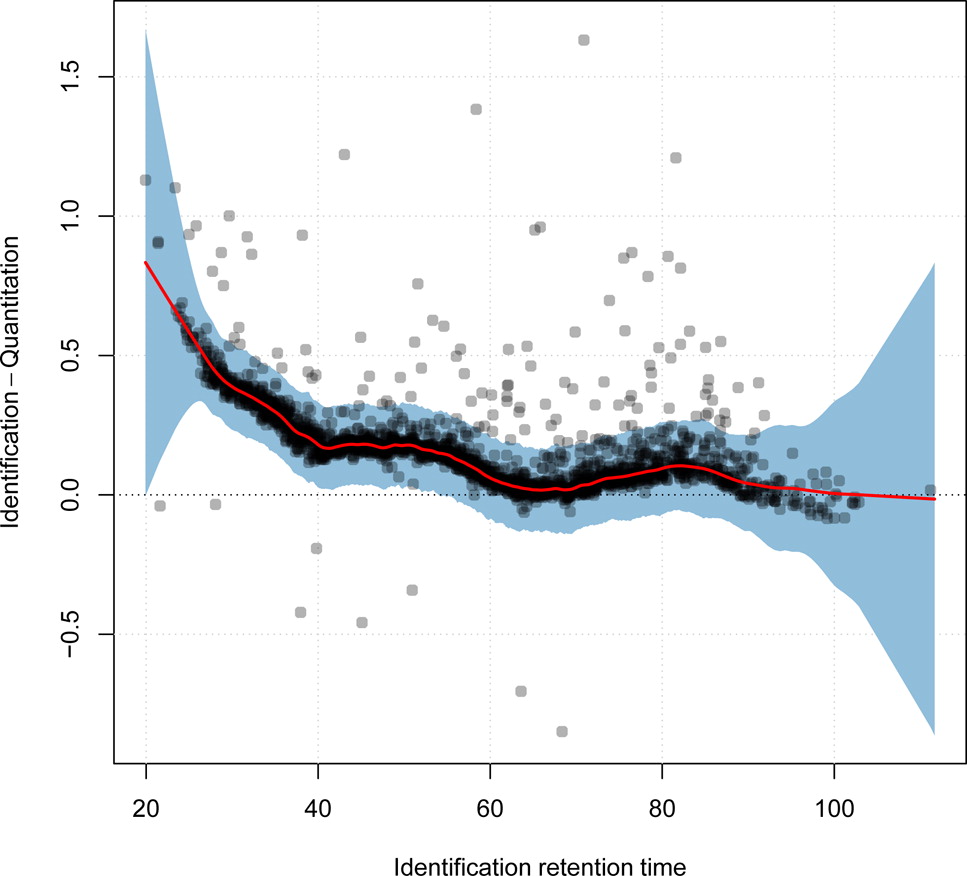 ] .right-col-50[ 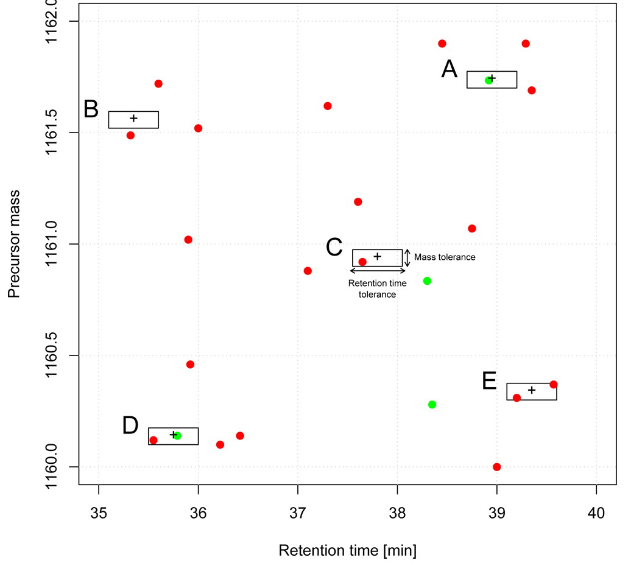 ] .left-col-100[ From Bond *et al.* [Improving Qualitative and Quantitative Performance for MSE-based Label-free Proteomics](https://pubs.acs.org/doi/10.1021/pr300776t). ] --- ### Missing values - Filtering. - Imputation: considering the underlying nature of missingness, i.e missing not at random (left-censored) or at random.  Lazar *et al.* [Accounting for the Multiple Natures of Missing Values in Label-Free Quantitative Proteomics Data Sets to Compare Imputation Strategies](http://dx.doi.org/10.1021/acs.jproteome.5b00981). ??? Root-mean-square error (RMSE) observations standard deviation ratio (RSR), KNN and MinDet imputation. Lower (blue) is better. --- class: middle ### Recap  ??? What we have seen so far. --- class: middle ### Challenges  ??? Turning the many buttons independently. --- class: middle ### Challenges 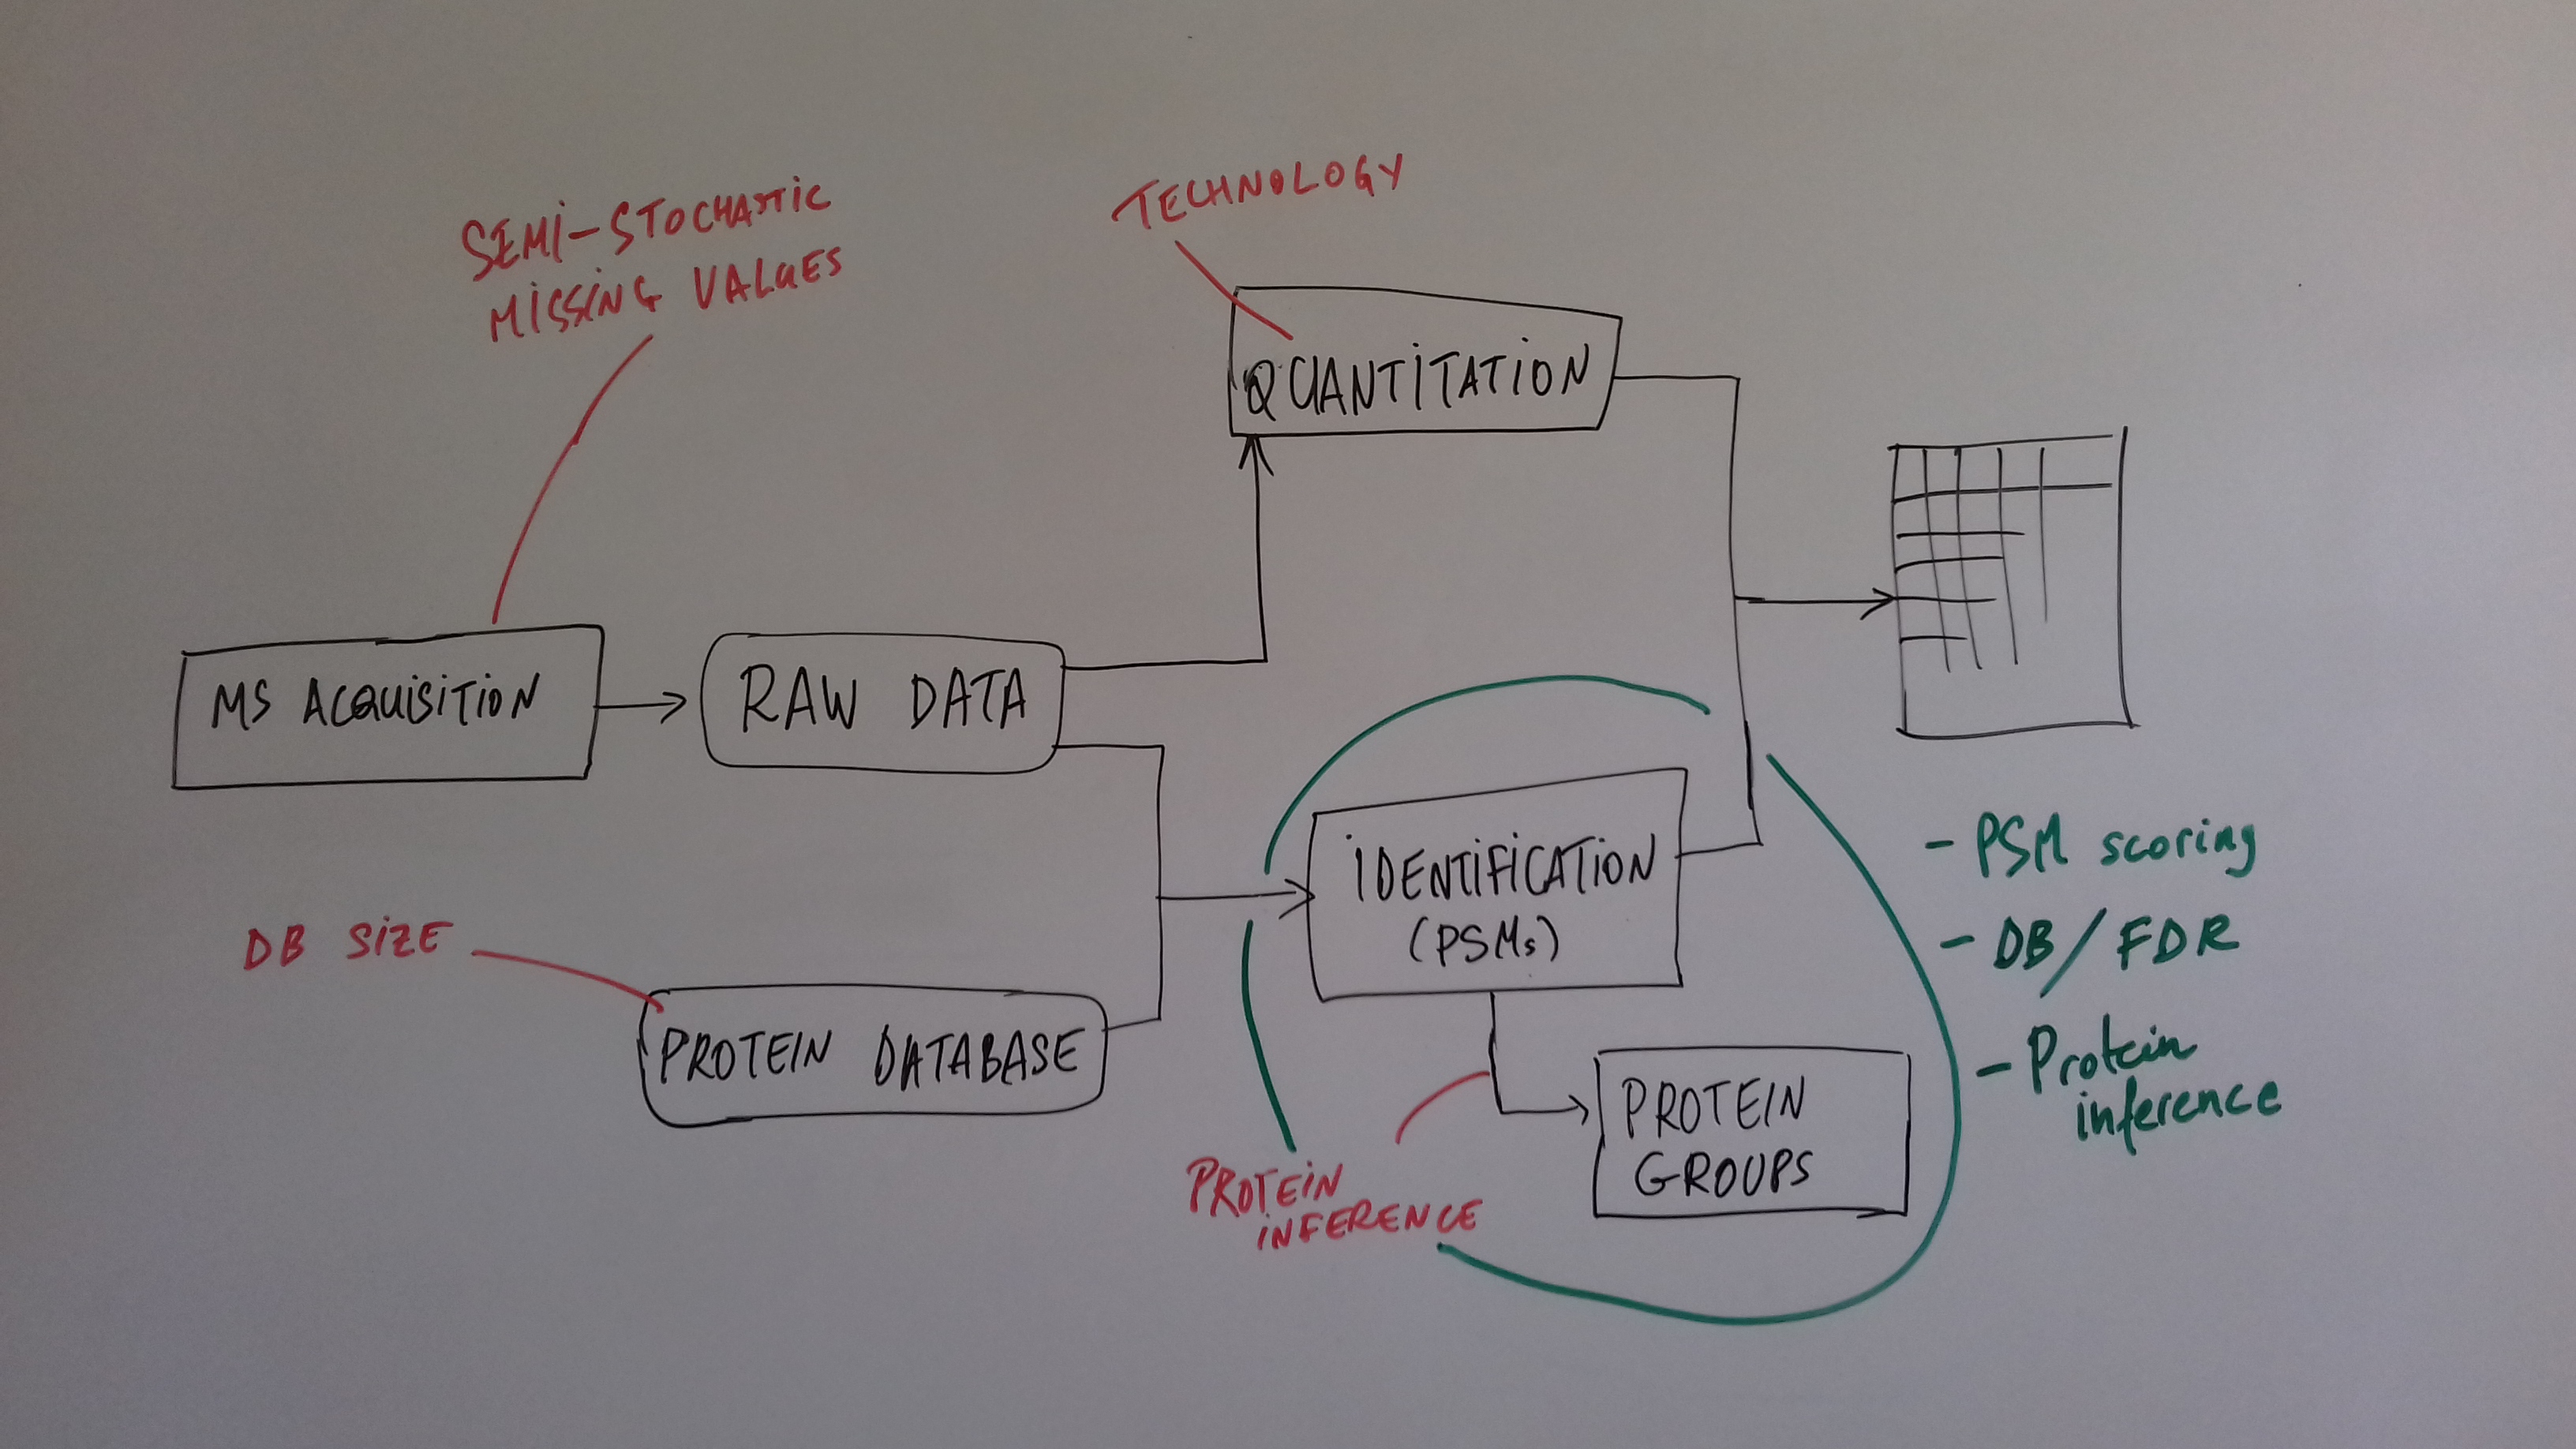 ??? Turning the many buttons independently. --- class: middle ### Challenges 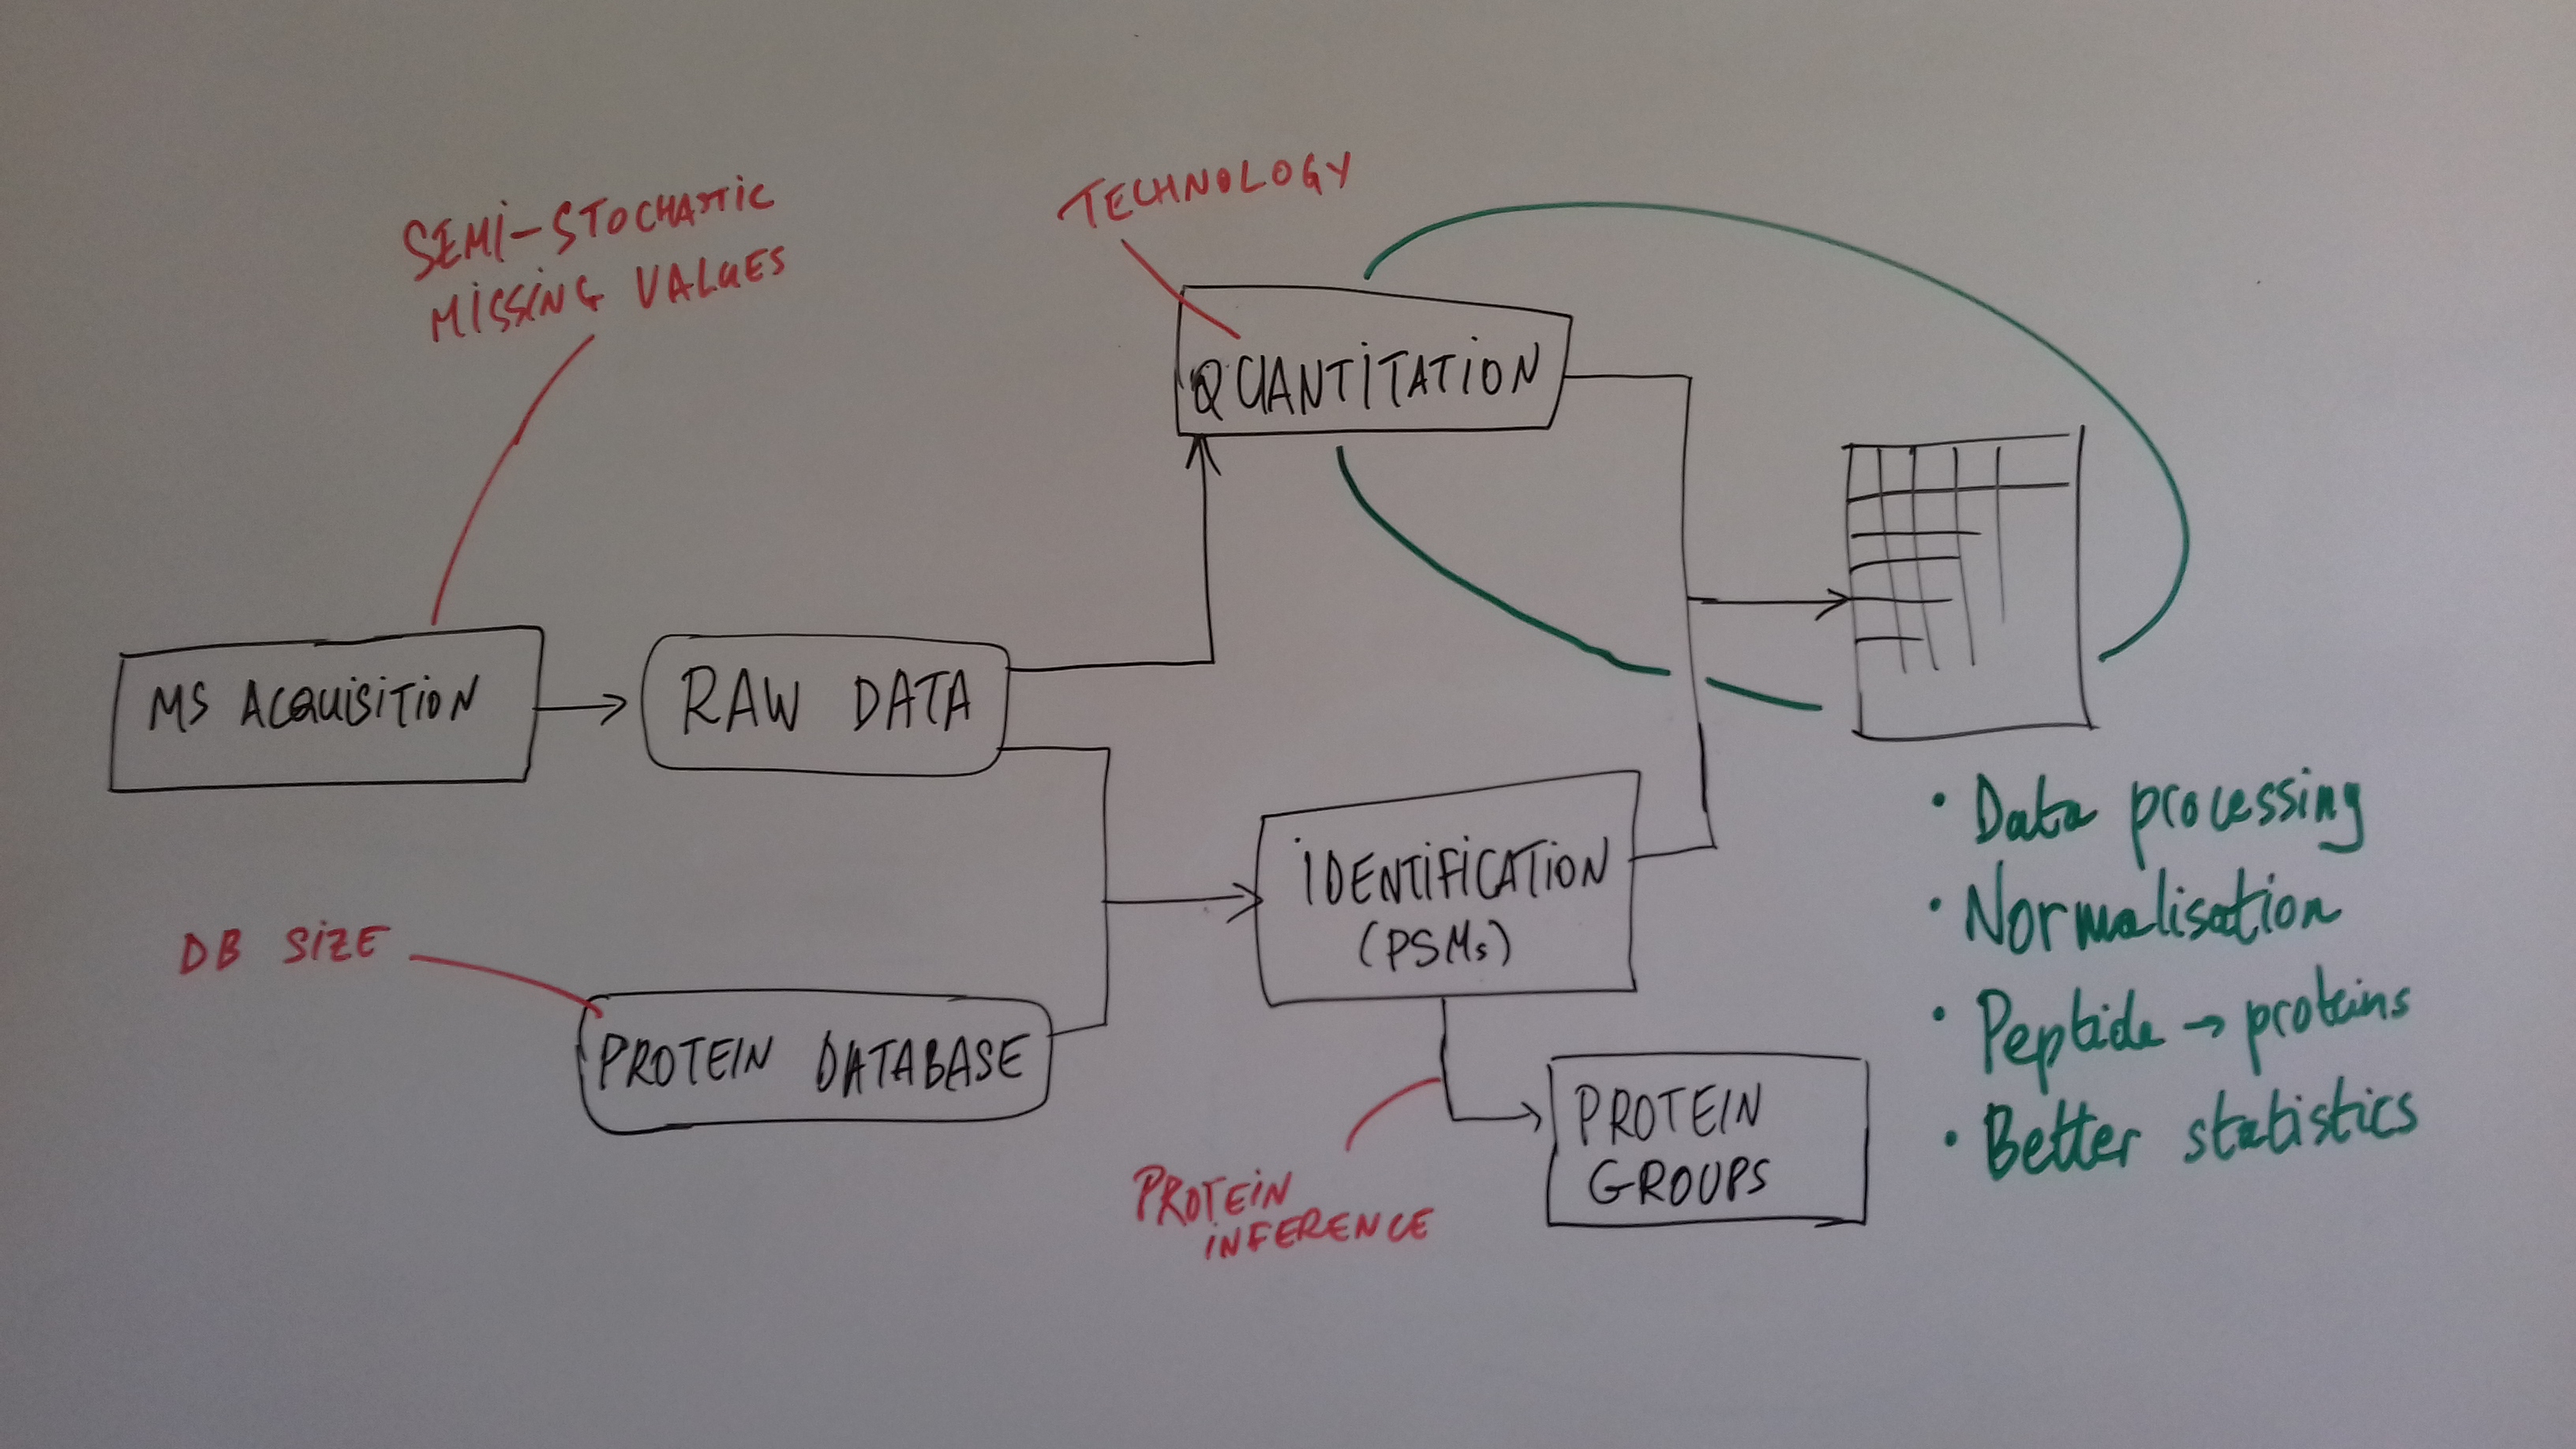 ??? Turning the many buttons independently. --- class: middle ### Challenges 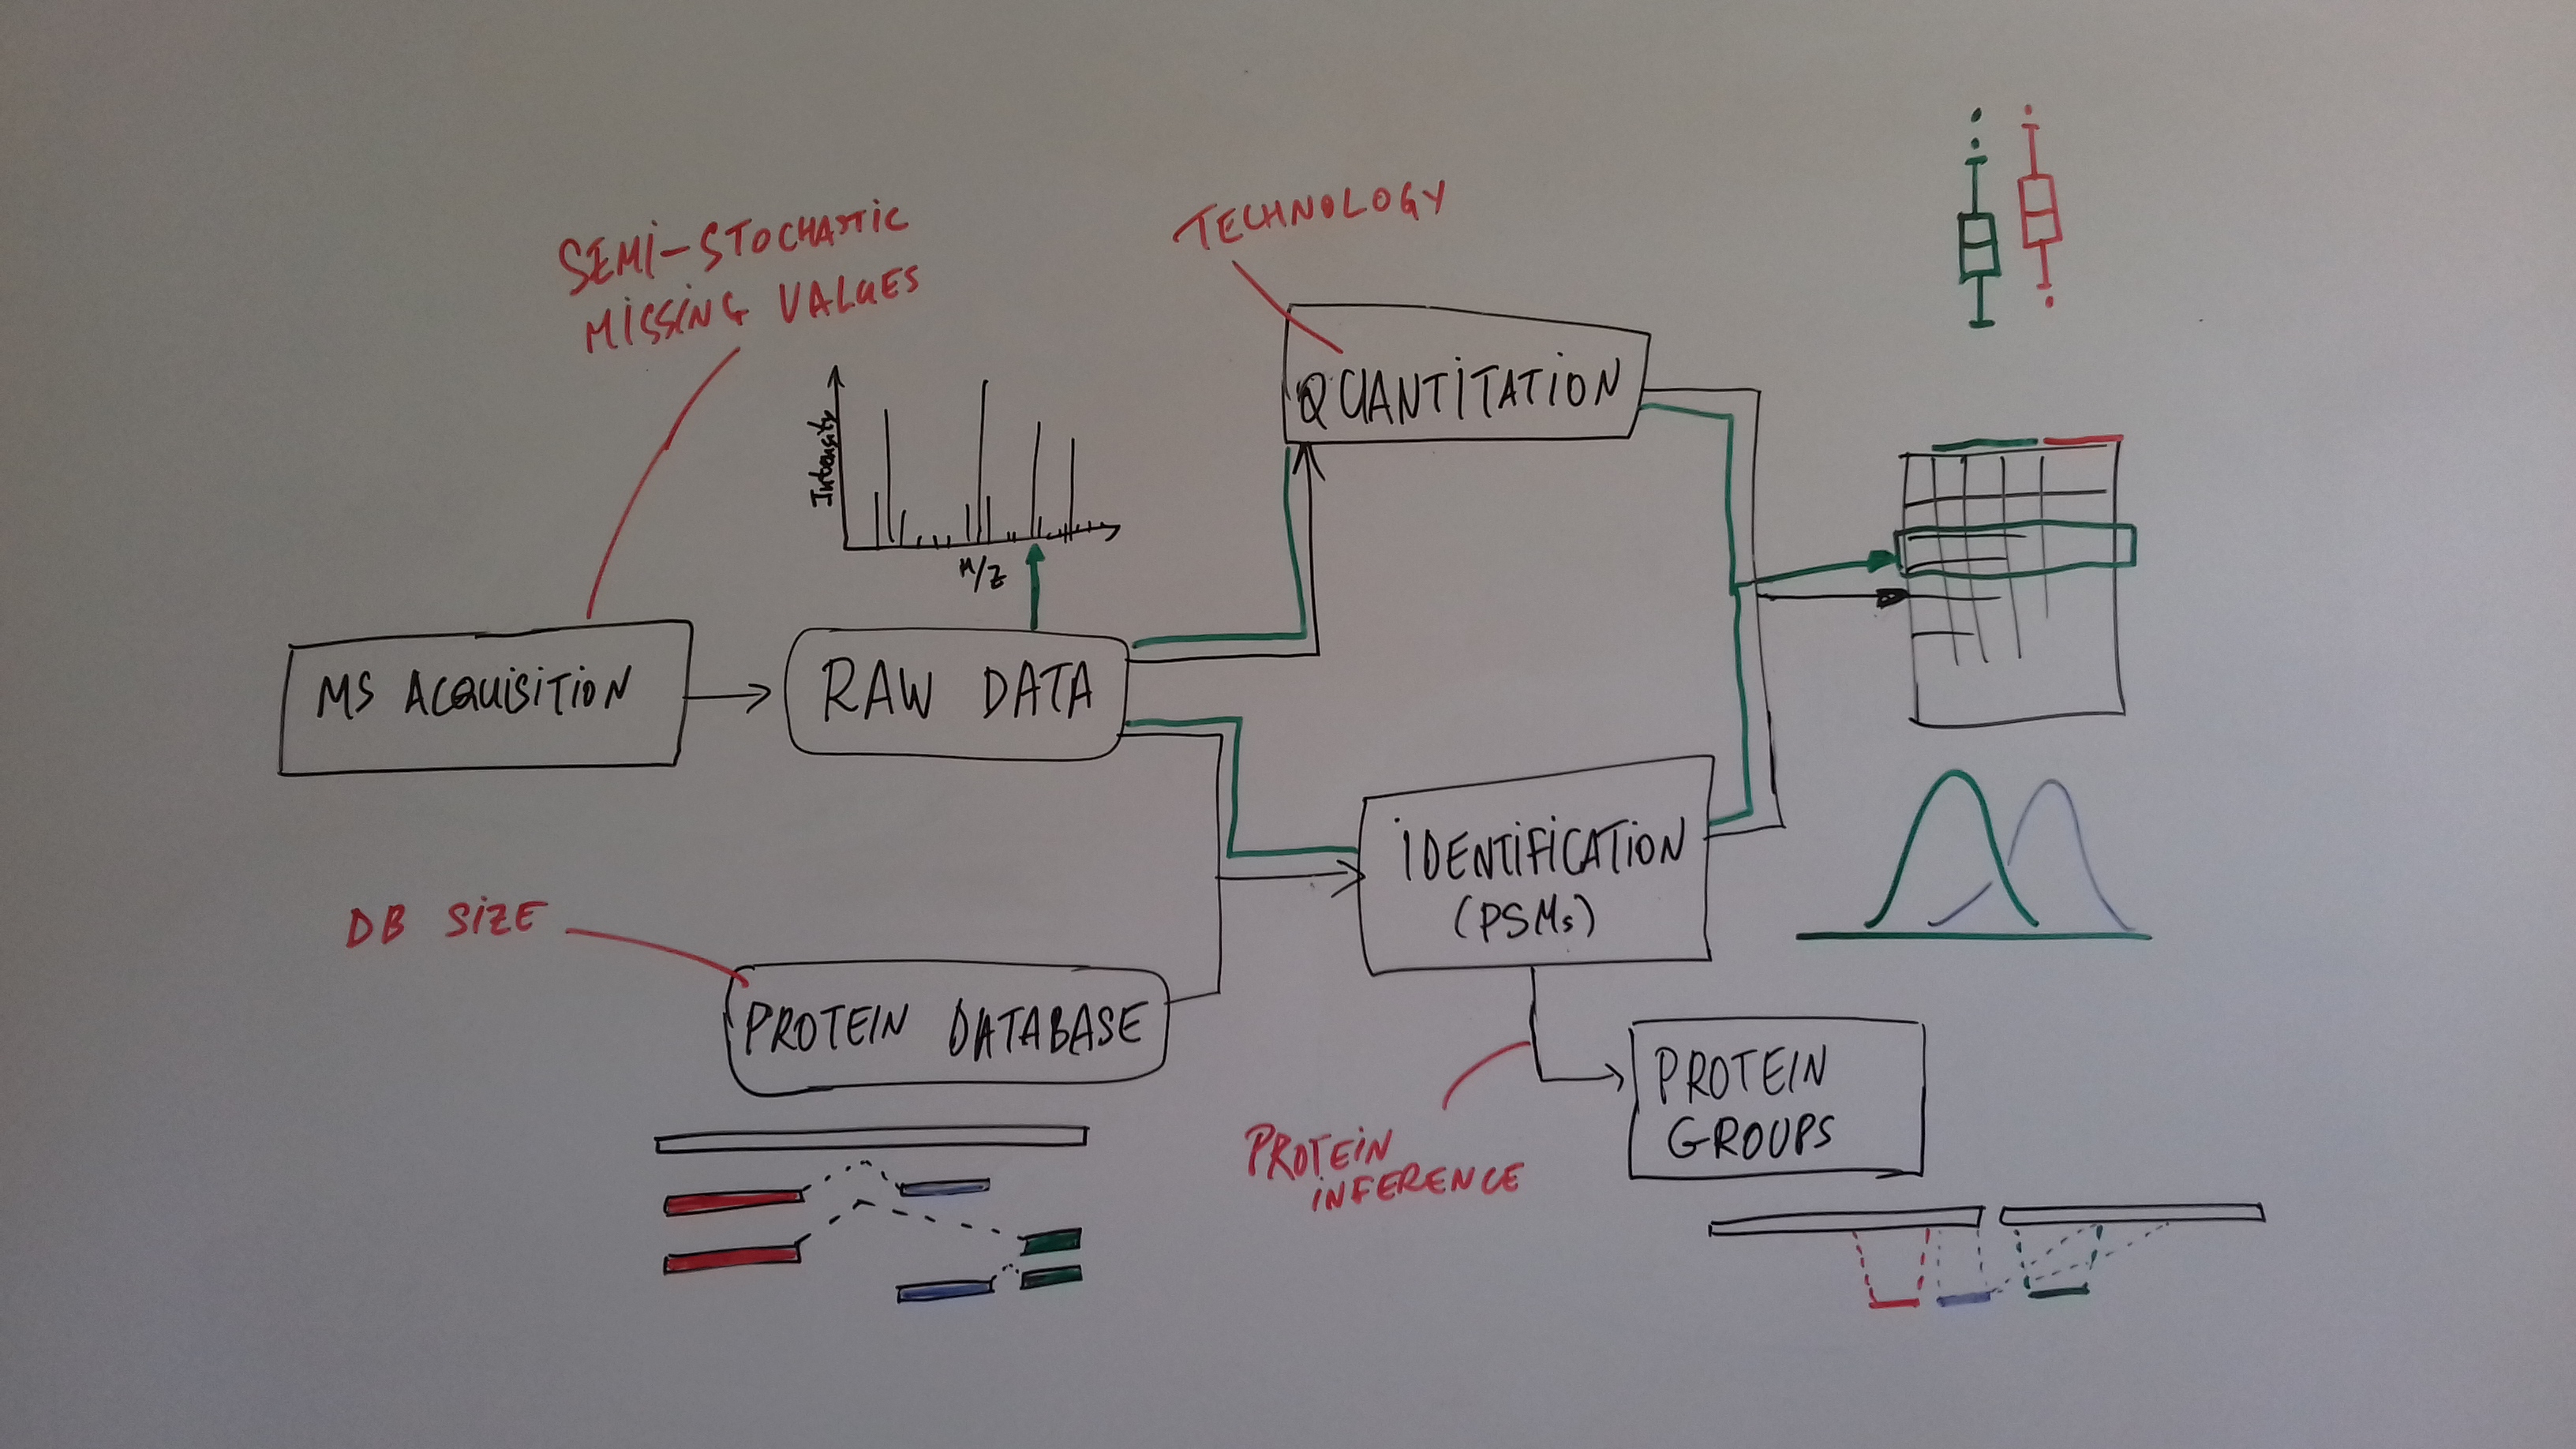 ??? - These different parts aren't independent - Linking results to raw and identification data. ## Examples - Is it better to quantify everything and search for differentially expressed features (even if not identified) and pay a heavy code for my p-value adjustment, or am I better off applying a stringent filter at the identification level to limit the number of tests? - Wouldn't it be better to focus on peptide-level data analysis and avoid the protein inference problem, rather than work with protein-level summaries? ## Take-home message 2: How could we control the whole process, and directly account for the dependency of these different parts of a typical proteomcis pipeline? --- ### Bioconductor software infrastructure .left-col-75[ #### Raw data: `mzML` `MSnbase::readMSData` to read raw data into R as `MSnExp`. #### Identification data: `mzid` `MSnbase::readMzIdData` as a `data.frame`. #### Quantitative data `MSnbase::readMSData2` as an `MSnSet`. ] .right-col-25[ <img src="https://raw.githubusercontent.com/Bioconductor/BiocStickers/master/MSnbase/MSnbase.png" alt="MSnbase" style="width: 150px; padding: 10px"/> <img src="https://raw.githubusercontent.com/Bioconductor/BiocStickers/master/mzR/mzR.png" alt="mzR" style="width: 150px; padding: 10px"/> ] ??? What are we going to see in the [lab](https://rawgit.com/lgatto/bioc-ms-prot/master/lab.html) this afternoon - I'll start with a refreshed of what I have presented now - An overview of packages and functionality available in various R/Bioc packages - Where to find data - Existing infrastructure for raw, id and quant data - Some routes of general data analysis, such as differential analysis, classification, dimensinality reduction, ... as seen during other lectures. Also mention **tags**. --- class: middle ### Other technologies: DIA Data Independent Acquisition (DIA) (as opposed to Data Dependent Acquisition - DDA). Examples: - `\(MS^{E}\)`, where the whole M/Z range is fragmented (at different energies) and precursors and fragment ions are matched using their elution profiles, by Waters. - SWATH-MS (Sequential Windowed Acquisition of All Theoretical Fragment Ion Mass Spectra) by AB Sciex - AIF (All-ion fragmentation, similar to `\(MS^E\)`) by Thermo Fisher. - ... The advantage of these DIA methods is that all the data are recorded; they have the potential to analyse all the data, thus limiting the number of missing values. See Law and Lim [Recent advances in mass spectrometry: data independent analysis and hyper reaction monitoring](https://www.tandfonline.com/doi/full/10.1586/14789450.2013.858022). ??? - DIA methods are maturing, but arguably not as widely applied as DDA. They also require specific software (commercial solution, PLGS for MSe) that is arguably not the very best one can hope for. - SWATH-MS acquisition uses pre-defined real spectra libraries libraries and also requires dedicated software (OpenSWATH, a open and good software). SWATH-MS is also considered having high throughout as well as reproducibility and consistency (in the hands of experts). --- class: middle ### Other technologies: targeted proteomics Selected/multiple/parallel reaction monitoring (SRMs, MRM, PRM) are pre-defined MS features that the instrument will specifically scan for. This is the method to assay a limited number of peptides/proteins in a high number of samples. --- class: middle ### Other technologies: single cell proteomics using CyTOF In **mass cytometry**, rare earth metals are used as reporters on antibodies. Analysis of metal abundances using the mass cytometer allows determination of the expression of 100s of markers in 1000s individual cells. See Giesen *et al.* [Highly multiplexed imaging of tumor tissues with subcellular resolution by mass cytometry](https://www.nature.com/articles/nmeth.2869) and Bendall *et al.* [Single-Cell Mass Cytometry of Differential Immune and Drug Responses Across a Human Hematopoietic Continuum](http://science.sciencemag.org/content/332/6030/687.full). --- class: middle ### Other technologies: single cell proteomics using MS Single Cell ProtEomics by Mass Spectrometry (SCoPE-MS) can quantify thousands of proteins in single mammalian cells. 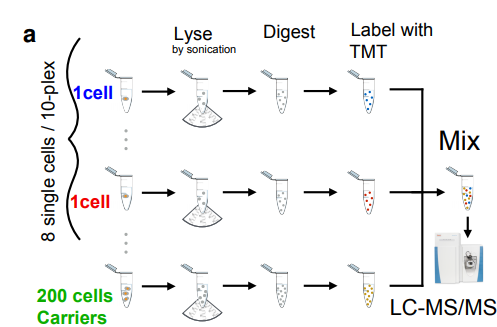 Budnik *et al.* [Mass-spectrometry of single mammalian cells quantifies proteome heterogeneity during cell differentiation](https://www.biorxiv.org/content/early/2018/01/01/102681). See also Zhu *et al.* [Nanodroplet processing platform for deep and quantitative proteome profiling of 10–100 mammalian cells](https://www.nature.com/articles/s41467-018-03367-w). ??? A major issue in MS-based proteomics is dynamic range (up to `\(10^9\)`), and proteins of very low abundance are always hard to quantify. (Reminder: there is no PCR equivalent for oligopeptides) The difficulty to measure low abundance proteins becomes even more accute when low amounts of biological material are used, in particular single cells. --- class: middle ### Additional dimensions - Post-translational modifications (PTMs) - Protein-protein interactions (PPI) - Protein sub-cellular localisation (spatial proteomics) When based on MS, all points discussed above will remain relevant. ??? - There are additional dimensions to the study of proteins, such as .... - When based on MS, all points discussed above will be relevant too. --- class: middle name: laurent-gatto .left-col-50[ <img src="./img/lgatto3b.png" width = "180px"/> ### Laurent Gatto <i class="fas fa-map-marker-alt"></i> University of Cambridge<br /> <i class="fas fa-map-marker-alt"></i> [de Duve Institute](http://www.deduveinstitute.be/), UCLouvain<br /> <br /> <i class="fas fa-home"></i> https://lgatto.github.io<br /> <i class="fab fa-twitter"></i> [@lgatto](https://twitter.com/lgatt0/)<br /> <i class="fab fa-github"></i> [lgatto](https://github.com/lgatto/)<br /> <img width="20px" align="top" alt="orcid" src="./img/orcid_64x64.png" /> [0000-0002-1520-2268](https://orcid.org/0000-0002-1520-2268)<br /> <img width="20px" align="top" alt="Impact story" src="./img/keybase.png"/> [lgatto](https://keybase.io/lgatto)<br /> <img width="20px" align="top" alt="Google scholar" src="./img/gscholar.png"/> [Google scholar](https://scholar.google.co.uk/citations?user=k5DrB74AAAAJ&hl=en)<br /> <img width="20px" align="top" alt="Impact story" src="./img/impactstory-logo.png"/> [Impact story](https://profiles.impactstory.org/u/0000-0002-1520-2268)<br /> <i class="fas fa-pencil-alt"></i> [dissem.in](https://dissem.in/r/6231/laurent-gatto)<br /> <!-- <i class="fab fa-linkedin"></i> https://www.linkedin.com/in/lgatto/<br /> --> ] .rigth-col-50[ **Acknowledgements**: [BBSRC](http://www.bbsrc.ac.uk/) and the [Wellcome Trust](https://wellcome.ac.uk/) and collaborators/contributors [Lisa Breckels](https://github.com/lmsimp/), [Olly Crook](https://olivercrook.co.uk/), [Sebastian Gibb](https://sgibb.github.io/) and [Johannes Rainer](https://github.com/jotsetung/). **New positions available** at the de Duve Institute, in Brussels. ## Thank you for your attention ### Find the slides at [http://bit.ly/20180712csama](http://bit.ly/20180712csama) ]