Basic quality assurance and control, and data manipulation in spreadsheets
Authors:Christie Bahlai, Aleksandra Pawlik
Contributors: Jennifer Bryan, Alexander Duryee, Jeffrey Hollister, Daisie Huang, Owen Jones,
Ben Marwick, and Ethan White
When you have a well-structured data table, you can use several simple techniques within your spreadsheet to ensure the data you enter is free of errors. These approaches include techniques that are implemented prior to entering data (quality assurance) and techniques that are used after entering data to check for errors (quality control).
Quality Assurance
Quality assurance stops bad data from ever being entered by checking to see if values are valid during data entry. For example, if research is being conducted at sites A, B, and C, then the value V (which is right next to B on the keyboard) should never be entered. Likewise if one of the kinds of data being collected is a count, only integers greater than or equal to zero should be allowed.
To control the kind of data entered into a a spreadsheet we use Data Validation (Excel) or Validity (Libre Office Calc), to set the values that can be entered in each data column.
1. Select the cells or column you want to validate
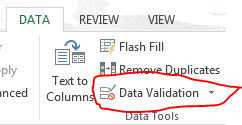
2. On the Data tab select Data Validation
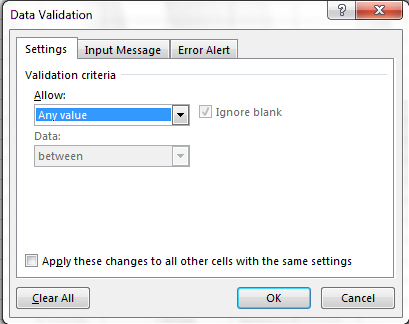
3. In the Allow box select the kind of data that should be in the
column. Options include whole numbers, decimals, lists of items, dates, and
other values.
4. After selecting an item enter any additional details. For example if you’ve
chosen a list of values then enter a comma-delimited list of allowable
values in the Source box.
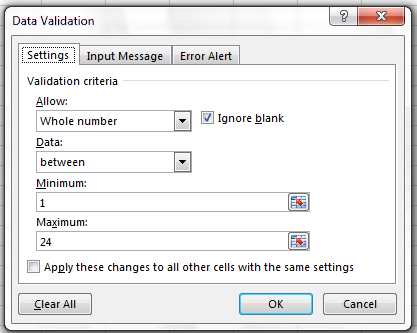
Let’s try this out by setting the plot column in our spreadsheet to only allow plot values that are integers between 1 and 24.
- Select the
plot_idcolumn - On the
Datatab selectData Validation - In the
Allowbox selectWhole number - Set the minimum and maximum values to 1 and 24.
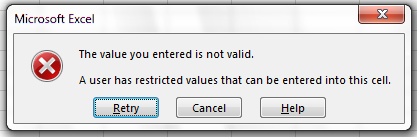
Now let’s try entering a new value in the plot column that isn’t a valid plot. The spreadsheet stops us from entering the wrong value and asks us if we would like to try again.
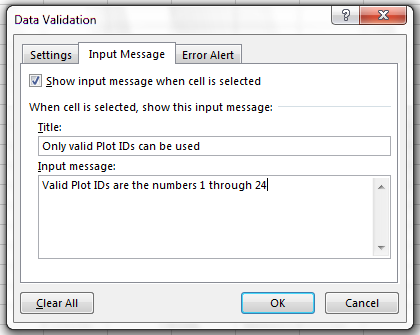
You can also customize the resulting message to be more informative by entering
your own message in the Input Message tab
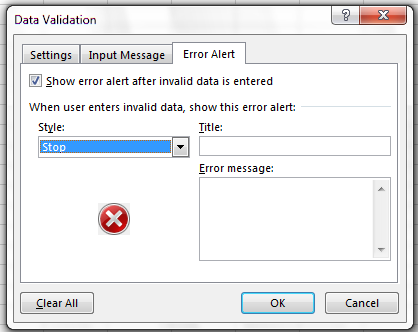
and allow invalid data to just result in a warning by modifying the Style
option on the Error Alert tab.
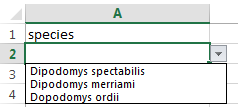
Quality assurance can make data entry easier as well as more robust. For example, if you use a list of options to restrict data entry, the spreadsheet will provide you with a drop-downlist of the available items. So, instead of trying to remember how to spell Dipodomys spectabilis, you can just select the right option from the list.
Quality Control
Tip! Before doing any quality control operations, save your original file with the formulas and a name indicating it is the original data. Create a separate file with appropriate naming and versioning, and ensure your data is stored as values and not as formulas. Because formulas refer to other cells, and you may be moving cells around, you may compromise the integrity of your data if you do not take this step!
readMe (README) files: As you start manipulating your data files, create a readMe document / text file to keep track of your files and document your manipulations so that they may be easily understood and replicated, either by your future self or by an independent researcher. Your readMe file should document all of the files in your data set (including documentation), describe their content and format, and lay out the organizing principles of folders and subfolders. For each of the separate files listed, it is a good idea to document the manipulations or analyses that were carried out on those data.
Sorting
Bad values often sort to bottom or top of the column. For example, if your data should be numeric, then alphabetical and null data will group at the ends of the sorted data. Sort your data by each field, one at a time. Scan through each column, but pay the most attention to the top and the bottom of a column. If your dataset is well-structured and does not contain formulas, sorting should never affect the integrity of your dataset.
Conditional formatting
Use with caution! But a great way to flag inconsistent values when entering data.
Check on cell formats
A good way to check if you’ve got data of the wrong type in a column is by checking column format. This can also help prevent issues when you export your data.
(See also later how to explore the format (class) of your data in R.)
Pivot tables
Pivot tables are a very powerful tool in Excel. They’re useful to check for issues with data integrity because they provide a quick, visual way to spot things that are amiss, including with categorical variables. They are also great for reshaping data and obtaining summary statistics quickly in a drag and drop interface.
Why would I need to reshape my data? Different analyses require data to be in different formats- example: taking a species list to a diversity analysis.
Note: these operations can be done in most statistical or programming
packages (i.e. using dplyr in R).
Previous:Dates as data. Next: Exporting data from spreadsheets.