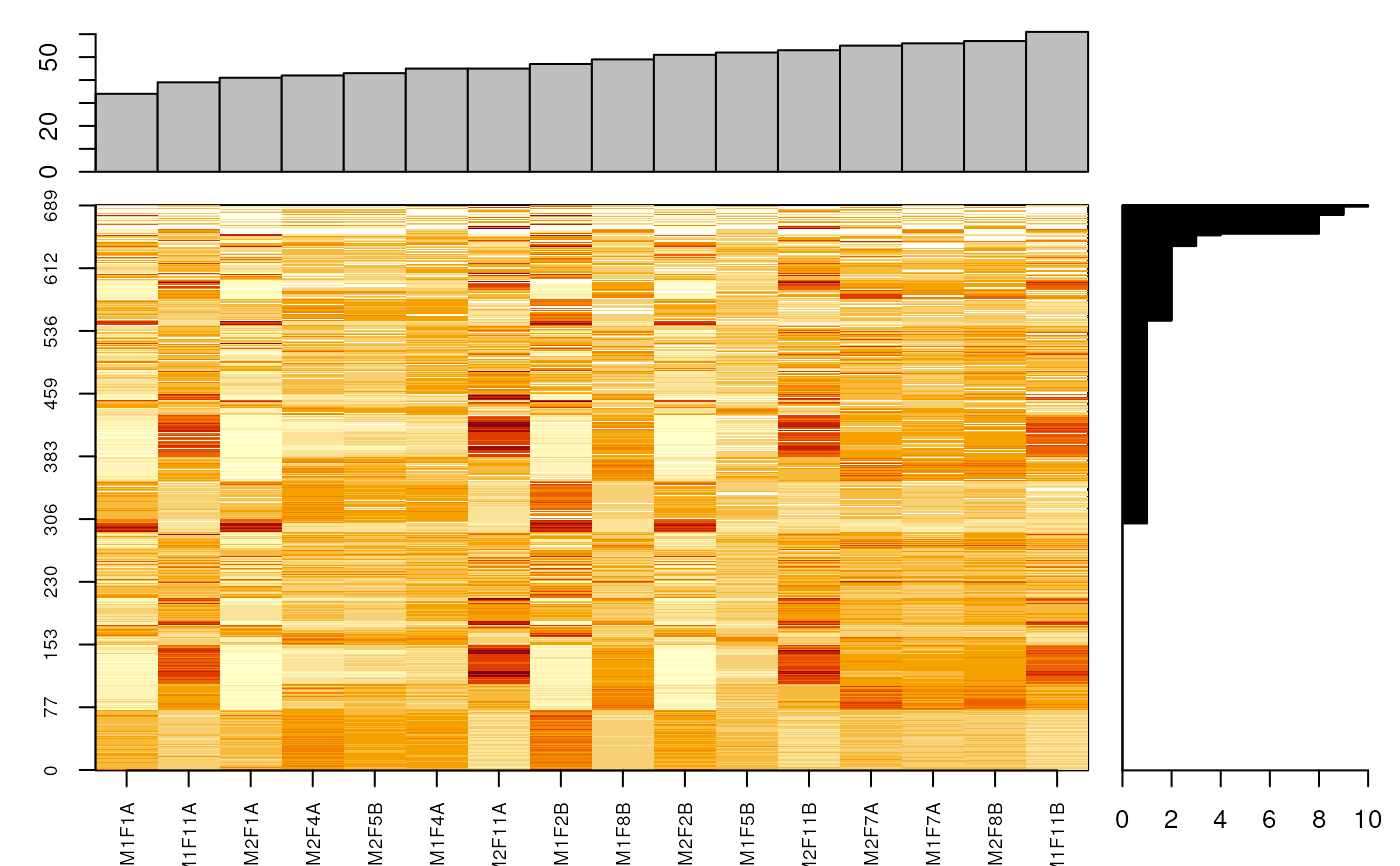
Visualise missing values as a heatmap and barplots along the samples and features.
Usage
naplot(
  object,
  verbose = isMSnbaseVerbose(),
  reorderRows = TRUE,
  reorderColumns = TRUE,
  ...
)
Arguments
- object
An object of class
MSnSet.- verbose
If verbose (default is
isMSnbaseVerbose()), print a table of missing values.- reorderRows
If reorderRows (default is
TRUE) rows are ordered by number of NA.- reorderColumns
If reorderColumns (default is
TRUE) columns are ordered by number of NA.- ...
Additional parameters passed to
image2.
Examples
data(naset)
naplot(naset)