Chapter 2 MS Introduction
2.1 How does mass spectrometry work?
Mass spectrometry (MS) is a technology that separates charged molecules (ions) based on their mass to charge ratio (M/Z). It is often coupled to chromatography (liquid LC, but can also be gas-based GC). The time an analytes takes to elute from the chromatography column is the retention time.
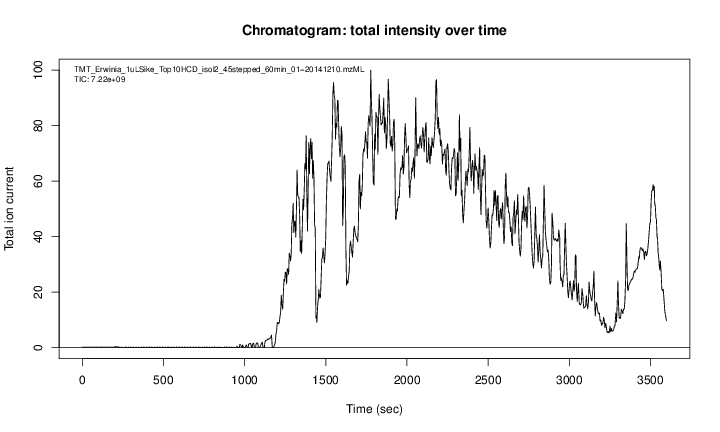
A chromatogram, illustrating the total amount of analytes over the retention time.
An mass spectrometer is composed of three components:
- The source, that ionises the molecules: examples are Matrix-assisted laser desorption/ionisation (MALDI) or electrospray ionisation. (ESI)
- The analyser, that separates the ions: Time of flight (TOF) or Orbitrap.
- The detector that quantifies the ions.
When using mass spectrometry for proteomics, the proteins are first digested with a protease such as trypsin. In mass shotgun proteomics, the analytes assayed in the mass spectrometer are peptides.
Often, ions are subjected to more than a single MS round. After a first round of separation, the peaks in the spectra, called MS1 spectra, represent peptides. At this stage, the only information we possess about these peptides are their retention time and their mass-to-charge (we can also infer their charge be inspecting their isotopic envelope, i.e the peaks of the individual isotopes, see below), which is not enough to infer their identify (i.e. their sequence).
In MSMS (or MS2), the settings of the mass spectrometer are set automatically to select a certain number of MS1 peaks (for example 20). Once a narrow M/Z range has been selected (corresponding to one high-intensity peak, a peptide, and some background noise), it is fragmented (using for example collision-induced dissociation (CID), higher energy collisional dissociation (HCD) or electron-transfer dissociation (ETD)). The fragment ions are then themselves separated in the analyser to produce a MS2 spectrum. The unique fragment ion pattern can then be used to infer the peptide sequence using de novo sequencing (when the spectrum is of high enough quality) of using a search engine such as, for example Mascot, MSGF+, ..., that will match the observed, experimental spectrum to theoratical spectra (see details below).
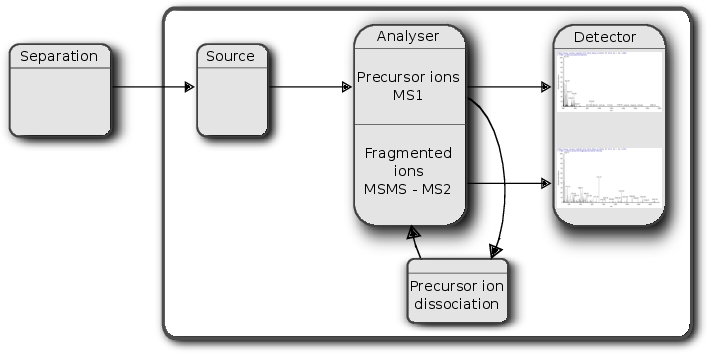
Schematics of a mass spectrometer and two rounds of MS.
The animation below show how 25 ions different ions (i.e. having different M/Z values) are separated throughout the MS analysis and are eventually detected (i.e. quantified). The final frame shows the hypothetical spectrum.
Separation and detection of ions in a mass spectrometer.
The figures below illustrate the two rounds of MS. The spectrum on the left is an MS1 spectrum acquired after 21 minutes and 3 seconds of elution. 10 peaks, highlited by dotted vertical lines, were selected for MS2 analysis. The peak at M/Z 460.79 (488.8) is highlighted by a red (orange) vertical line on the MS1 spectrum and the fragment spectra are shown on the MS2 spectrum on the top (bottom) right figure.
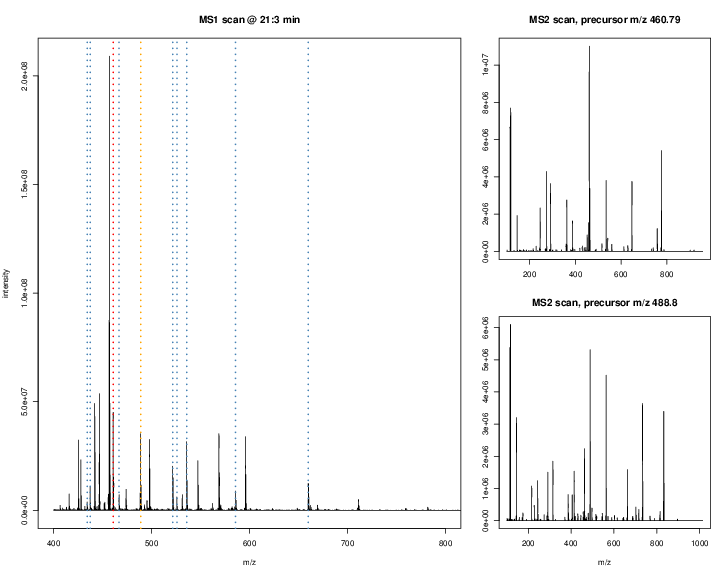
Parent ions in the MS1 spectrum (left) and two sected fragment ions MS2 spectra (right).
The figures below represent the 3 dimensions of MS data: a set of spectra (M/Z and intensity) of retention time, as well as the interleaved nature of MS1 and MS2 (and there could be more levels) data.
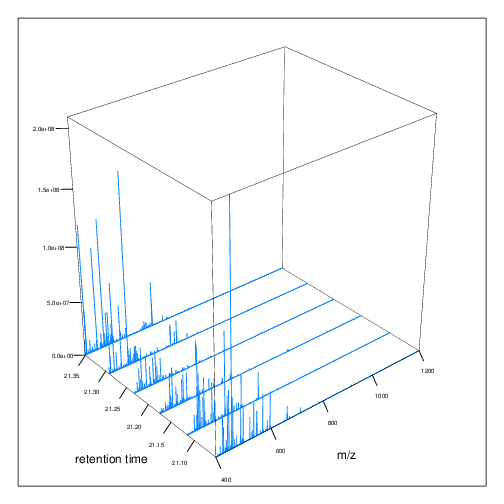
MS1 spectra over retention time.
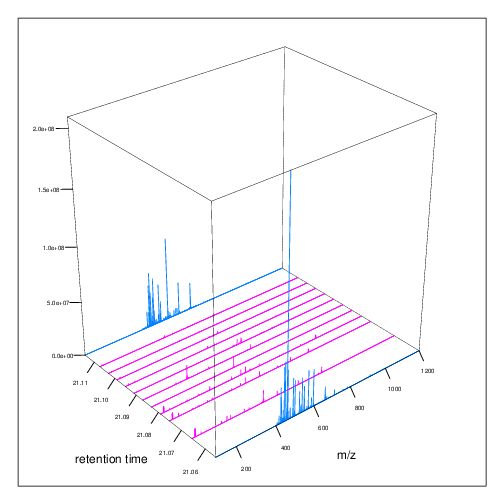
MS2 spectra interleaved between two MS1 spectra.
2.2 Accessing raw data
2.2.1 From the ProteomeXchange database
MS-based proteomics data is disseminated through the ProteomeXchange infrastructure, which centrally coordinates submission, storage and dissemination through multiple data repositories, such as the PRoteomics IDEntifications (PRIDE) database at the EBI for mass spectrometry-based experiments (including quantitative data, as opposed as the name suggests), PASSEL at the ISB for Selected Reaction Monitoring (SRM, i.e. targeted) data and the MassIVE resource. These data can be downloaded within R using the rpx package.
library("rpx")
pxannounced()
## 15 new ProteomeXchange annoucements## Data.Set Publication.Data Message
## 1 PXD009823 2021-01-11 19:53:23 New
## 2 PXD023182 2021-01-11 19:31:53 New
## 3 PXD009823 2021-01-11 19:15:50 New
## 4 PXD023119 2021-01-11 09:15:33 New
## 5 PXD020322 2021-01-11 08:36:51 New
## 6 PXD016960 2021-01-11 08:22:53 New
## 7 PXD002178 2021-01-11 08:22:32 New
## 8 PXD014445 2021-01-11 08:01:54 New
## 9 PXD022245 2021-01-11 07:58:24 New
## 10 PXD002177 2021-01-11 07:49:00 New
## 11 PXD014230 2021-01-11 07:48:20 New
## 12 PXD010554 2021-01-11 07:48:03 New
## 13 PXD014720 2021-01-11 07:36:09 New
## 14 PXD019257 2021-01-11 07:32:22 New
## 15 PXD021916 2021-01-11 07:29:21 NewUsing the unique PXD000001 identifier, we can retrieve the relevant metadata that will be stored in a PXDataset object. The names of the files available in this data can be retrieved with the pxfiles accessor function.
px <- PXDataset("PXD000001")
px
## Object of class "PXDataset"
## Id: PXD000001 with 11 files
## [1] 'F063721.dat' ... [11] 'erwinia_carotovora.fasta'
## Use 'pxfiles(.)' to see all files.pxfiles(px)## [1] "F063721.dat"
## [2] "F063721.dat-mztab.txt"
## [3] "PRIDE_Exp_Complete_Ac_22134.xml.gz"
## [4] "PRIDE_Exp_mzData_Ac_22134.xml.gz"
## [5] "PXD000001_mztab.txt"
## [6] "README.txt"
## [7] "TMT_Erwinia_1uLSike_Top10HCD_isol2_45stepped_60min_01-20141210.mzML"
## [8] "TMT_Erwinia_1uLSike_Top10HCD_isol2_45stepped_60min_01-20141210.mzXML"
## [9] "TMT_Erwinia_1uLSike_Top10HCD_isol2_45stepped_60min_01.mzXML"
## [10] "TMT_Erwinia_1uLSike_Top10HCD_isol2_45stepped_60min_01.raw"
## [11] "erwinia_carotovora.fasta"Other metadata for the px data set:
pxtax(px)## [1] "Erwinia carotovora"pxurl(px)## [1] "ftp://ftp.pride.ebi.ac.uk/pride/data/archive/2012/03/PXD000001"pxref(px)## [1] "Gatto L, Christoforou A. Using R and Bioconductor for proteomics data analysis. Biochim Biophys Acta. 2013 May 18. doi:pii: S1570-9639(13)00186-6. 10.1016/j.bbapap.2013.04.032"Data files can then be downloaded with the pxget function. Below, we retrieve the raw data file. The file is downloaded1 If the file is already available, it is not downloaded a second time. in the working directory and the name of the file is return by the function and stored in the mzf variable for later use.2 This and other files are also availabel in the msdata package, described below
fn <- "TMT_Erwinia_1uLSike_Top10HCD_isol2_45stepped_60min_01-20141210.mzML"
mzf <- pxget(px, fn)
## Loading TMT_Erwinia_1uLSike_Top10HCD_isol2_45stepped_60min_01-20141210.mzML from cache.mzf## [1] "/home/lgatto/.cache/rpx/79d8694e5060_TMT_Erwinia_1uLSike_Top10HCD_isol2_45stepped_60min_01-20141210.mzML"2.2.2 From AnnotationHub
AnnotationHub is a cloud resource set up and managed by the Bioconductor project that serves various omics datasets. It is possible to contribute and access (albeit currently only a limited number of) proteomics data.
library("AnnotationHub")
ah <- AnnotationHub()
## snapshotDate(): 2020-10-27query(ah, "proteomics")## AnnotationHub with 4 records
## # snapshotDate(): 2020-10-27
## # $dataprovider: PRIDE
## # $species: Erwinia carotovora
## # $rdataclass: mzRpwiz, mzRident, MSnSet, AAStringSet
## # additional mcols(): taxonomyid, genome, description,
## # coordinate_1_based, maintainer, rdatadateadded, preparerclass, tags,
## # rdatapath, sourceurl, sourcetype
## # retrieve records with, e.g., 'object[["AH49006"]]'
##
## title
## AH49006 | PXD000001: Erwinia carotovora and spiked-in protein fasta file
## AH49007 | PXD000001: Peptide-level quantitation data
## AH49008 | PXD000001: raw mass spectrometry data
## AH49009 | PXD000001: MS-GF+ identiciation datams <- ah[["AH49008"]]
ms## Mass Spectrometry file handle.
## Filename: ab7777b09e8_55314
## Number of scans: 7534The data contains 7534 spectra - 1431 MS1 spectra and 6103 MS2 spectra. The file name, ab7777b09e8_55314, is not very descriptive because the data originates from the AnnotationHub cloud repository. If the data was read from a local file, is would be named as the mzML (or mzXML) file (see below).
2.2.3 Data packages
Some data are also distributed through dedicated packages. The msdata, for example, provides some general raw data files relevant for both proteomics and metabolomics.
library("msdata")
## proteomics raw data
proteomics()
## [1] "MRM-standmix-5.mzML.gz"
## [2] "MS3TMT10_01022016_32917-33481.mzML.gz"
## [3] "MS3TMT11.mzML"
## [4] "TMT_Erwinia_1uLSike_Top10HCD_isol2_45stepped_60min_01-20141210.mzML.gz"
## [5] "TMT_Erwinia_1uLSike_Top10HCD_isol2_45stepped_60min_01.mzML.gz"## proteomics identification data
ident()## [1] "TMT_Erwinia_1uLSike_Top10HCD_isol2_45stepped_60min_01-20141210.mzid"## quantitative data
quant()## [1] "cptac_a_b_peptides.txt"More often, such experiment packages distribute processed data; an example of such is the pRolocdata package, that offers quantitative proteomics data.
pRolocdata::pRolocdata()| Item | Title |
|---|---|
| Barylyuk2020ToxoLopit | Whole-cell spatial proteome of Toxoplasma: molecular anatomy of an apicomplexan cell |
| E14TG2aR | LOPIT experiment on Mouse E14TG2a Embryonic Stem Cells from Breckels et al. (2016) |
| E14TG2aS1 | LOPIT experiment on Mouse E14TG2a Embryonic Stem Cells from Breckels et al. (2016) |
| E14TG2aS1goCC | LOPIT experiment on Mouse E14TG2a Embryonic Stem Cells from Breckels et al. (2016) |
| E14TG2aS1yLoc | LOPIT experiment on Mouse E14TG2a Embryonic Stem Cells from Breckels et al. (2016) |
| E14TG2aS2 | LOPIT experiment on Mouse E14TG2a Embryonic Stem Cells from Breckels et al. (2016) |
| HEK293T2011 | LOPIT experiment on Human Embryonic Kidney fibroblast HEK293T cells from Breckels et al. (2013) |
| HEK293T2011goCC | LOPIT experiment on Human Embryonic Kidney fibroblast HEK293T cells from Breckels et al. (2013) |
| HEK293T2011hpa | LOPIT experiment on Human Embryonic Kidney fibroblast HEK293T cells from Breckels et al. (2013) |
| Kozik_con | Small molecule enhancers of endosome-to-cytosol import augment anti-tumour immunity |
| Kozik_pra | Small molecule enhancers of endosome-to-cytosol import augment anti-tumour immunity |
| Kozik_tam | Small molecule enhancers of endosome-to-cytosol import augment anti-tumour immunity |
| Shin2019MitoControlrep1 | Spatial proteomics defines the content of trafficking vesicles captured by golgin tethers |
| Shin2019MitoControlrep2 | Spatial proteomics defines the content of trafficking vesicles captured by golgin tethers |
| Shin2019MitoControlrep3 | Spatial proteomics defines the content of trafficking vesicles captured by golgin tethers |
| Shin2019MitoGcc88rep1 | Spatial proteomics defines the content of trafficking vesicles captured by golgin tethers |
| Shin2019MitoGcc88rep2 | Spatial proteomics defines the content of trafficking vesicles captured by golgin tethers |
| Shin2019MitoGcc88rep3 | Spatial proteomics defines the content of trafficking vesicles captured by golgin tethers |
| Shin2019MitoGol97rep1 | Spatial proteomics defines the content of trafficking vesicles captured by golgin tethers |
| Shin2019MitoGol97rep2 | Spatial proteomics defines the content of trafficking vesicles captured by golgin tethers |
| Shin2019MitoGol97rep3 | Spatial proteomics defines the content of trafficking vesicles captured by golgin tethers |
| andreyev2010 | Six sub-cellular fraction data from mouse macrophage-like RAW264.7 cells from Andreyev et al. (2009) |
| andreyev2010activ | Six sub-cellular fraction data from mouse macrophage-like RAW264.7 cells from Andreyev et al. (2009) |
| andreyev2010rest | Six sub-cellular fraction data from mouse macrophage-like RAW264.7 cells from Andreyev et al. (2009) |
| andy2011 | LOPIT experiment on Human Embryonic Kidney fibroblast HEK293T cells from Breckels et al. (2013) |
| andy2011goCC | LOPIT experiment on Human Embryonic Kidney fibroblast HEK293T cells from Breckels et al. (2013) |
| andy2011hpa | LOPIT experiment on Human Embryonic Kidney fibroblast HEK293T cells from Breckels et al. (2013) |
| at_chloro | The AT_CHLORO data base |
| baers2018 | Synechocystis spatial proteomics |
| beltran2016HCMV120 | Data from Beltran et al. 2016 |
| beltran2016HCMV24 | Data from Beltran et al. 2016 |
| beltran2016HCMV48 | Data from Beltran et al. 2016 |
| beltran2016HCMV72 | Data from Beltran et al. 2016 |
| beltran2016HCMV96 | Data from Beltran et al. 2016 |
| beltran2016MOCK120 | Data from Beltran et al. 2016 |
| beltran2016MOCK24 | Data from Beltran et al. 2016 |
| beltran2016MOCK48 | Data from Beltran et al. 2016 |
| beltran2016MOCK72 | Data from Beltran et al. 2016 |
| beltran2016MOCK96 | Data from Beltran et al. 2016 |
| davies2018ap4b1 | AP-4 vesicles contribute to spatial control of autophagy via RUSC-dependent peripheral delivery of ATG9A |
| davies2018ap4e1 | AP-4 vesicles contribute to spatial control of autophagy via RUSC-dependent peripheral delivery of ATG9A |
| davies2018wt | AP-4 vesicles contribute to spatial control of autophagy via RUSC-dependent peripheral delivery of ATG9A |
| dunkley2006 | LOPIT data from Dunkley et al. (2006) |
| dunkley2006goCC | LOPIT data from Dunkley et al. (2006) |
| fabre2015r1 | Data from Fabre et al. 2015 |
| fabre2015r2 | Data from Fabre et al. 2015 |
| foster2006 | PCP data from Foster et al. (2006) |
| groen2014cmb | LOPIT experiments on Arabidopsis thaliana roots, from Groen et al. (2014) |
| groen2014r1 | LOPIT experiments on Arabidopsis thaliana roots, from Groen et al. (2014) |
| groen2014r1goCC | LOPIT experiments on Arabidopsis thaliana roots, from Groen et al. (2014) |
| groen2014r2 | LOPIT experiments on Arabidopsis thaliana roots, from Groen et al. (2014) |
| groen2014r3 | LOPIT experiments on Arabidopsis thaliana roots, from Groen et al. (2014) |
| hall2009 | LOPIT data from Hall et al. (2009) |
| havugimana2012 | Data from Havugimana et al. 2012 |
| hirst2018 | Data from Hirst et al. 2018 |
| hyperLOPIT2015 | Protein and PMS-level hyperLOPIT datasets on Mouse E14TG2a embryonic stem cells from Christoforou et al. (2016). |
| hyperLOPIT2015goCC | Protein and PMS-level hyperLOPIT datasets on Mouse E14TG2a embryonic stem cells from Christoforou et al. (2016). |
| hyperLOPIT2015ms2 | Protein and PMS-level hyperLOPIT datasets on Mouse E14TG2a embryonic stem cells from Christoforou et al. (2016). |
| hyperLOPIT2015ms2psm | Protein and PMS-level hyperLOPIT datasets on Mouse E14TG2a embryonic stem cells from Christoforou et al. (2016). |
| hyperLOPIT2015ms3r1 | Protein and PMS-level hyperLOPIT datasets on Mouse E14TG2a embryonic stem cells from Christoforou et al. (2016). |
| hyperLOPIT2015ms3r1psm | Protein and PMS-level hyperLOPIT datasets on Mouse E14TG2a embryonic stem cells from Christoforou et al. (2016). |
| hyperLOPIT2015ms3r2 | Protein and PMS-level hyperLOPIT datasets on Mouse E14TG2a embryonic stem cells from Christoforou et al. (2016). |
| hyperLOPIT2015ms3r2psm | Protein and PMS-level hyperLOPIT datasets on Mouse E14TG2a embryonic stem cells from Christoforou et al. (2016). |
| hyperLOPIT2015ms3r3 | Protein and PMS-level hyperLOPIT datasets on Mouse E14TG2a embryonic stem cells from Christoforou et al. (2016). |
| hyperLOPITU2OS2017 | 2017 and 2018 hyperLOPIT on U2OS cells |
| hyperLOPITU2OS2017b | 2017 and 2018 hyperLOPIT on U2OS cells |
| hyperLOPITU2OS2018 | 2017 and 2018 hyperLOPIT on U2OS cells |
| itzhak2016helaCtrl | Global, quantitative and dynamic mapping of protein subcellular localization |
| itzhak2016helaEgf | Global, quantitative and dynamic mapping of protein subcellular localization |
| itzhak2016stcSILAC | Data from Itzhak et al. (2016) |
| itzhak2017 | Data from Itzhak et al. 2017 |
| itzhak2017markers | Data from Itzhak et al. 2017 |
| kirkwood2013 | Data from Kirkwood et al. 2013. |
| krahmer2018pcp | Subcellular Reorganization in Diet-Induced Hepatic Steatosis |
| krahmer2018phosphopcp | Subcellular Reorganization in Diet-Induced Hepatic Steatosis |
| kristensen2012r1 | Data from Kristensen et al. 2012 |
| kristensen2012r2 | Data from Kristensen et al. 2012 |
| kristensen2012r3 | Data from Kristensen et al. 2012 |
| lopimsSyn1 | LOPIMS data for the Synapter 2.0 paper |
| lopimsSyn2 | LOPIMS data for the Synapter 2.0 paper |
| lopimsSyn2_0frags | LOPIMS data for the Synapter 2.0 paper |
| lopitdcU2OS2018 | 2017 and 2018 hyperLOPIT on U2OS cells |
| mulvey2015 | Data from Mulvey et al. 2015 |
| mulvey2015norm | Data from Mulvey et al. 2015 |
| nikolovski2012 | Meta-analysis from Nikolovski et al. (2012) |
| nikolovski2012imp | Meta-analysis from Nikolovski et al. (2012) |
| nikolovski2014 | LOPIMS data from Nikolovski et al. (2014) |
| orre2019a431 | SubCellBarCode: Proteome-wide Mapping of Protein Localization and Relocalization |
| orre2019h322 | SubCellBarCode: Proteome-wide Mapping of Protein Localization and Relocalization |
| orre2019hcc827 | SubCellBarCode: Proteome-wide Mapping of Protein Localization and Relocalization |
| orre2019hcc827gef | SubCellBarCode: Proteome-wide Mapping of Protein Localization and Relocalization |
| orre2019hcc827rep1 | SubCellBarCode: Proteome-wide Mapping of Protein Localization and Relocalization |
| orre2019hcc827rep2 | SubCellBarCode: Proteome-wide Mapping of Protein Localization and Relocalization |
| orre2019hcc827rep3 | SubCellBarCode: Proteome-wide Mapping of Protein Localization and Relocalization |
| orre2019mcf7 | SubCellBarCode: Proteome-wide Mapping of Protein Localization and Relocalization |
| orre2019u251 | SubCellBarCode: Proteome-wide Mapping of Protein Localization and Relocalization |
| rodriguez2012r1 | Spatial proteomics of human inducible goblet-like LS174T cells from Rodriguez-Pineiro et al. (2012) |
| rodriguez2012r2 | Spatial proteomics of human inducible goblet-like LS174T cells from Rodriguez-Pineiro et al. (2012) |
| rodriguez2012r3 | Spatial proteomics of human inducible goblet-like LS174T cells from Rodriguez-Pineiro et al. (2012) |
| stekhoven2014 | Data from Stekhoven et al. 2014 |
| tan2009r1 | LOPIT data from Tan et al. (2009) |
| tan2009r1goCC | LOPIT data from Tan et al. (2009) |
| tan2009r2 | LOPIT data from Tan et al. (2009) |
| tan2009r3 | LOPIT data from Tan et al. (2009) |
| trotter2010 | LOPIT data sets used in Trotter et al. (2010) |
| trotter2010shallow | LOPIT data sets used in Trotter et al. (2010) |
| trotter2010steep | LOPIT data sets used in Trotter et al. (2010) |
| yeast2018 | Saccharomyces cerevisiae spatial proteomics (2018) |
Page built: 2021-01-12