The QFeatures class
Laurent Gatto and Christophe Vanderaa
Source:vignettes/v01-QFeaturesClass.Rmd
v01-QFeaturesClass.RmdLast modified: 2020-12-15 15:18:02
Compiled: Tue Dec 15 15:52:35 2020
Learning Objectives The goals of this workshop are to provide a real-life example of step-by-step quantitative proteomics data analysis using the QFeatures package. This vignette focuses on the QFeatures infrastructure.
Introduction
Mass spectrometry-based quantitative proteomics data can be representated as a matrix of quantitative values for features (PSMs, peptides, proteins) arranged along the rows, measured for a set of samples, arranged along the columns. The is a common representation for any quantitative data set. We will be using the SummarizedExperiment (Morgan et al. 2020) class:
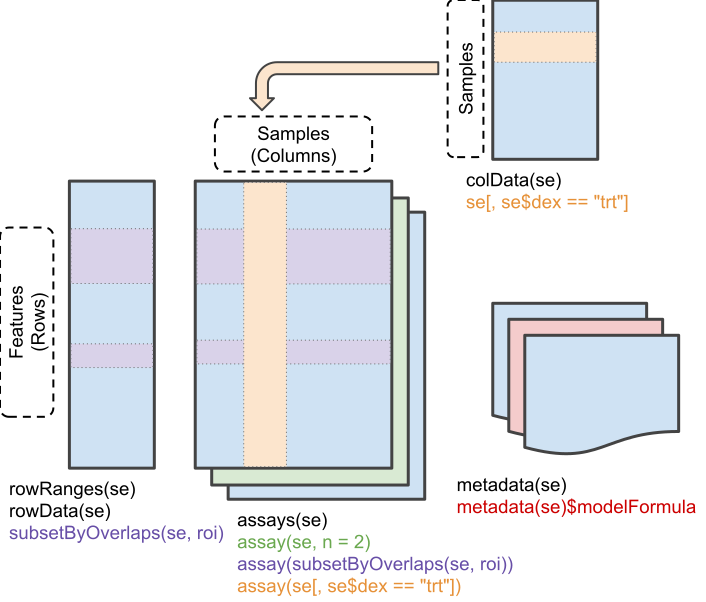
Schematic representation of the anatomy of a SummarizedExperiment object. (Figure taken from the SummarizedExperiment package vignette.)
- The sample (columns) metadata can be access with the
colData()function. - The features (rows) metadata can be access with the
rowData()column. - If the features represent ranges along genomic coordinates, these can be accessed with
rowRanges() - Additional metadata describing the overall experiment can be accessed with
metadata(). - The quantiative data can be accessed with
assay(). -
assays()returns a list of matrix-like assays.
QFeatures
While mass spectrometers acquire data for spectra/peptides, the biological entity of interest are the protein. As part of the data processing, we are thus required to aggregate low-level quantitative features into higher level data.
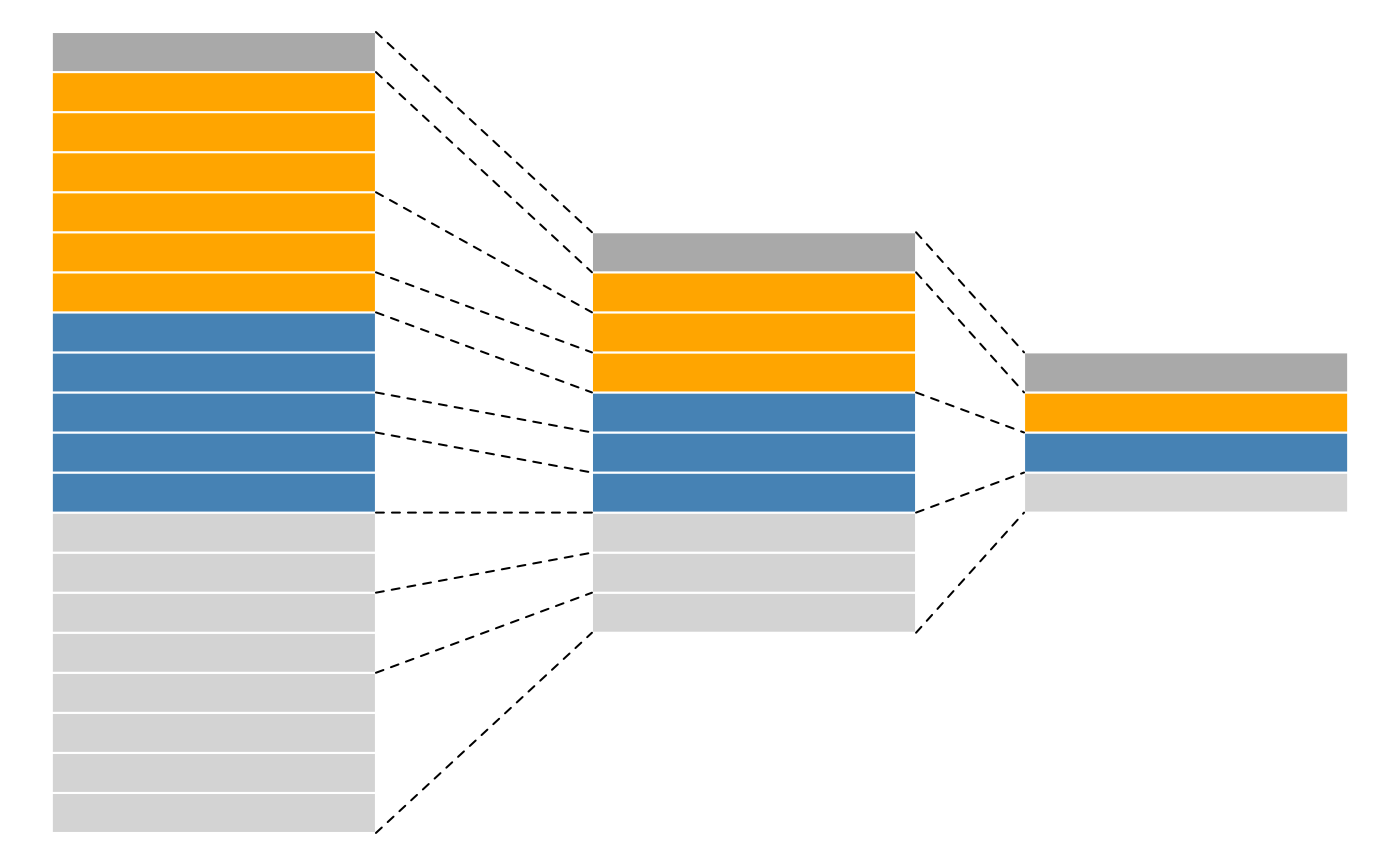
Conceptual representation of a QFeatures object and the aggregative relation between different assays.
We are going to start to familiarise ourselves with the QFeatures class implemented in the QFeatures package. The class is derived from the Bioconductor MultiAssayExperiment (Ramos et al. 2017) class. Let’s start by loading the QFeatures package.
Next, we load the feat1 test data, which is composed of single assay of class SummarizedExperiment composed of 10 rows and 2 columns.
data(feat1)
feat1
## An instance of class QFeatures containing 1 assays:
##  [1] psms: SummarizedExperiment with 10 rows and 2 columns
Let’s perform some simple operations to familiarise ourselves with the QFeatures class:
- Extract the sample metadata using the
colData()accessor (like you have previously done withSummarizedExperimentobjects).
colData(feat1)
## DataFrame with 2 rows and 1 column
##        Group
##    <integer>
## S1         1
## S2 2- Extract the first (and only) assay composing this
QFeauresdata using the[[operator (as you have done to extract elements of a list) by using the assay’s index or name.
feat1[[1]]
## class: SummarizedExperiment
## dim: 10 2
## metadata(0):
## assays(1): ''
## rownames(10): PSM1 PSM2 ... PSM9 PSM10
## rowData names(5): Sequence Protein Var location pval
## colnames(2): S1 S2
## colData names(0):
feat1[["psms"]]
## class: SummarizedExperiment
## dim: 10 2
## metadata(0):
## assays(1): ''
## rownames(10): PSM1 PSM2 ... PSM9 PSM10
## rowData names(5): Sequence Protein Var location pval
## colnames(2): S1 S2
## colData names(0):- Extract the
psmsassay’s row data and quantitative values.
assay(feat1[[1]])
##       S1 S2
## PSM1   1 11
## PSM2   2 12
## PSM3   3 13
## PSM4   4 14
## PSM5   5 15
## PSM6   6 16
## PSM7   7 17
## PSM8   8 18
## PSM9   9 19
## PSM10 10 20
rowData(feat1[[1]])
## DataFrame with 10 rows and 5 columns
##            Sequence     Protein       Var      location      pval
##         <character> <character> <integer>   <character> <numeric>
## PSM1       SYGFNAAR       ProtA         1 Mitochondr...     0.084
## PSM2       SYGFNAAR       ProtA         2 Mitochondr...     0.077
## PSM3       SYGFNAAR       ProtA         3 Mitochondr...     0.063
## PSM4       ELGNDAYK       ProtA         4 Mitochondr...     0.073
## PSM5       ELGNDAYK       ProtA         5 Mitochondr...     0.012
## PSM6       ELGNDAYK       ProtA         6 Mitochondr...     0.011
## PSM7  IAEESNFPFI...       ProtB         7       unknown     0.075
## PSM8  IAEESNFPFI...       ProtB         8       unknown     0.038
## PSM9  IAEESNFPFI...       ProtB         9       unknown     0.028
## PSM10 IAEESNFPFI...       ProtB        10       unknown     0.097
Feature aggregation
The central functionality of the QFeatures infrastructure is the aggregation of features into higher-level features while retaining the link between the different levels. This can be done with the aggregateFeatures() function.
The call below will
- operate on the
psmsassay of thefeat1objects; - aggregate the rows the assay following the grouping defined in the
peptidesrow data variables; - perform aggregation using the
colMeans()function; - create a new assay named
peptidesand add it to thefeat1object.
feat1 <- aggregateFeatures(feat1, i = "psms",
                           fcol = "Sequence",
                           name = "peptides",
                           fun = colMeans)
feat1
## An instance of class QFeatures containing 2 assays:
##  [1] psms: SummarizedExperiment with 10 rows and 2 columns
## [2] peptides: SummarizedExperiment with 3 rows and 2 columns- Let’s convince yourself that we understand the effect of feature aggregation and repeat the calculations manually and check the content of the new assay’s row data.
## SYGFNAAR
colMeans(assay(feat1[[1]])[1:3, ])
## S1 S2
##  2 12
assay(feat1[[2]])["SYGFNAAR", ]
## S1 S2
##  2 12

## ELGNDAYK
colMeans(assay(feat1[[1]])[4:6, ])
## S1 S2
##  5 15
assay(feat1[[2]])["ELGNDAYK", ]
## S1 S2
##  5 15

## IAEESNFPFIK
colMeans(assay(feat1[[1]])[7:10, ])
##   S1   S2
##  8.5 18.5
assay(feat1[[2]])["IAEESNFPFIK", ]
##   S1   S2
##  8.5 18.5
rowData(feat1[[2]])
## DataFrame with 3 rows and 4 columns
##                  Sequence     Protein      location        .n
##               <character> <character>   <character> <integer>
## ELGNDAYK         ELGNDAYK       ProtA Mitochondr...         3
## IAEESNFPFIK IAEESNFPFI...       ProtB       unknown         4
## SYGFNAAR         SYGFNAAR       ProtA Mitochondr...         3
We can now aggregate the peptide-level data into a new protein-level assay using the colMedians() aggregation function.
feat1 <- aggregateFeatures(feat1, i = "peptides",
                           fcol = "Protein",
                           name = "proteins",
                           fun = colMedians)
feat1
## An instance of class QFeatures containing 3 assays:
##  [1] psms: SummarizedExperiment with 10 rows and 2 columns
##  [2] peptides: SummarizedExperiment with 3 rows and 2 columns
##  [3] proteins: SummarizedExperiment with 2 rows and 2 columns
assay(feat1[["proteins"]])
##        S1   S2
## ProtA 3.5 13.5
## ProtB 8.5 18.5
Subsetting and filtering
The link between the assays becomes apparent when we now subset the assays for protein A as shown below or using the subsetByFeature() function. This creates a new instance of class QFeatures containing assays with the expression data for protein, its peptides and their PSMs.
feat1["ProtA", , ]
## An instance of class QFeatures containing 3 assays:
##  [1] psms: SummarizedExperiment with 6 rows and 2 columns
##  [2] peptides: SummarizedExperiment with 2 rows and 2 columns
##  [3] proteins: SummarizedExperiment with 1 rows and 2 columns
The filterFeatures() function can be used to filter rows the assays composing a QFeatures object using the row data variables. We can for example retain rows that have a pval < 0.05, which would only keep rows in the psms assay because the pval is only relevant for that assay.
filterFeatures(feat1, ~ pval < 0.05)
## An instance of class QFeatures containing 1 assays:
##  [1] psms: SummarizedExperiment with 4 rows and 2 columns
On the other hand, if we filter assay rows for those that localise to the mitochondrion, we retain the relevant protein, peptides and PSMs.
filterFeatures(feat1, ~ location == "Mitochondrion")
## An instance of class QFeatures containing 3 assays:
##  [1] psms: SummarizedExperiment with 6 rows and 2 columns
##  [2] peptides: SummarizedExperiment with 2 rows and 2 columns
##  [3] proteins: SummarizedExperiment with 1 rows and 2 columns
As an exercise, let’s filter rows that do not localise to the mitochondrion.
filterFeatures(feat1, ~ location != "Mitochondrion")
## An instance of class QFeatures containing 3 assays:
##  [1] psms: SummarizedExperiment with 4 rows and 2 columns
##  [2] peptides: SummarizedExperiment with 1 rows and 2 columns
##  [3] proteins: SummarizedExperiment with 1 rows and 2 columns
You can refer to the Quantitative features for mass spectrometry data vignette and the QFeature manual page for more details about the class.
Session information
sessionInfo()
## R Under development (unstable) (2020-11-02 r79396)
## Platform: x86_64-pc-linux-gnu (64-bit)
## Running under: Ubuntu 20.04.1 LTS
##
## Matrix products: default
## BLAS/LAPACK: /usr/lib/x86_64-linux-gnu/openblas-pthread/libopenblasp-r0.3.8.so
##
## locale:
##  [1] LC_CTYPE=en_US.UTF-8       LC_NUMERIC=C
##  [3] LC_TIME=en_US.UTF-8        LC_COLLATE=en_US.UTF-8
##  [5] LC_MONETARY=en_US.UTF-8    LC_MESSAGES=C
##  [7] LC_PAPER=en_US.UTF-8       LC_NAME=C
##  [9] LC_ADDRESS=C               LC_TELEPHONE=C
## [11] LC_MEASUREMENT=en_US.UTF-8 LC_IDENTIFICATION=C
##
## attached base packages:
## [1] parallel  stats4    stats     graphics  grDevices utils     datasets
## [8] methods   base
##
## other attached packages:
##  [1] QFeatures_1.1.0             MultiAssayExperiment_1.17.2
##  [3] SummarizedExperiment_1.21.1 Biobase_2.51.0
##  [5] GenomicRanges_1.43.1        GenomeInfoDb_1.27.3
##  [7] IRanges_2.25.5              S4Vectors_0.29.6
##  [9] BiocGenerics_0.37.0         MatrixGenerics_1.3.0
## [11] matrixStats_0.57.0          BiocStyle_2.19.1
##
## loaded via a namespace (and not attached):
##  [1] compiler_4.1.0          BiocManager_1.30.10     highr_0.8
##  [4] XVector_0.31.1          ProtGenerics_1.23.5     bitops_1.0-6
##  [7] tools_4.1.0             zlibbioc_1.37.0         digest_0.6.27
## [10] lattice_0.20-41         evaluate_0.14           memoise_1.1.0
## [13] rlang_0.4.9             Matrix_1.2-18           DelayedArray_0.17.5
## [16] yaml_2.2.1              pkgdown_1.6.1           xfun_0.19
## [19] GenomeInfoDbData_1.2.4  stringr_1.4.0           knitr_1.30
## [22] MsCoreUtils_1.3.1       desc_1.2.0              fs_1.5.0
## [25] systemfonts_0.3.2       grid_4.1.0              rprojroot_2.0.2
## [28] R6_2.5.0                textshaping_0.2.1       rmarkdown_2.6
## [31] AnnotationFilter_1.15.0 magrittr_2.0.1          MASS_7.3-53
## [34] htmltools_0.5.0         assertthat_0.2.1        ragg_0.4.0
## [37] stringi_1.5.3           lazyeval_0.2.2          RCurl_1.98-1.2
## [40] crayon_1.3.4
References
Morgan, Martin, Valerie Obenchain, Jim Hester, and Hervé Pagès. 2020. SummarizedExperiment: SummarizedExperiment Container. https://bioconductor.org/packages/SummarizedExperiment.
Ramos, Marcel, Lucas Schiffer, Angela Re, Rimsha Azhar, Azfar Basunia, Carmen Rodriguez Cabrera, Tiffany Chan, et al. 2017. “Software for the Integration of Multi-Omics Experiments in Bioconductor.” Cancer Research 77(21); e39-42.