Representation of chromatographic MS data
Source:R/functions-Chromatogram.R, R/methods-Chromatogram.R
Chromatogram-class.RdThe Chromatogram class is designed to store
chromatographic MS data, i.e. pairs of retention time and intensity
values. Instances of the class can be created with the
Chromatogram constructor function but in most cases the dedicated
methods for OnDiskMSnExp and
MSnExp objects extracting chromatograms should be
used instead (i.e. the chromatogram() method).
Usage
Chromatogram(
  rtime = numeric(),
  intensity = numeric(),
  mz = c(NA_real_, NA_real_),
  filterMz = c(NA_real_, NA_real_),
  precursorMz = c(NA_real_, NA_real_),
  productMz = c(NA_real_, NA_real_),
  fromFile = integer(),
  aggregationFun = character(),
  msLevel = 1L
)

aggregationFun(object)

# S4 method for class 'Chromatogram'
show(object)

# S4 method for class 'Chromatogram'
rtime(object)

# S4 method for class 'Chromatogram'
intensity(object)

# S4 method for class 'Chromatogram'
mz(object, filter = FALSE)

# S4 method for class 'Chromatogram'
precursorMz(object)

# S4 method for class 'Chromatogram'
fromFile(object)

# S4 method for class 'Chromatogram'
length(x)

# S4 method for class 'Chromatogram'
as.data.frame(x)

# S4 method for class 'Chromatogram'
filterRt(object, rt)

# S4 method for class 'Chromatogram'
clean(object, all = FALSE, na.rm = FALSE)

# S4 method for class 'Chromatogram,ANY'
plot(
  x,
  col = "#00000060",
  lty = 1,
  type = "l",
  xlab = "retention time",
  ylab = "intensity",
  main = NULL,
  ...
)

# S4 method for class 'Chromatogram'
msLevel(object)

# S4 method for class 'Chromatogram'
isEmpty(x)

# S4 method for class 'Chromatogram'
productMz(object)

# S4 method for class 'Chromatogram'
bin(
  x,
  binSize = 0.5,
  breaks = seq(floor(min(rtime(x))), ceiling(max(rtime(x))), by = binSize),
  fun = max
)

# S4 method for class 'Chromatogram'
normalize(object, method = c("max", "sum"))

# S4 method for class 'Chromatogram'
filterIntensity(object, intensity = 0, ...)

# S4 method for class 'Chromatogram,Chromatogram'
alignRt(x, y, method = c("closest", "approx"), ...)

# S4 method for class 'Chromatogram,Chromatogram'
compareChromatograms(
  x,
  y,
  ALIGNFUN = alignRt,
  ALIGNFUNARGS = list(),
  FUN = cor,
  FUNARGS = list(use = "pairwise.complete.obs"),
  ...
)

# S4 method for class 'Chromatogram'
transformIntensity(object, FUN = identity)
Arguments
- rtime
for
Chromatogram:numericwith the retention times (length has to be equal to the length ofintensity).- intensity
for
Chromatogram:numericwith the intensity values (length has to be equal to the length ofrtime). ForfilterIntensity:numeric(1)orfunctionto use to filter intensities. See description for details.- mz
for
Chromatogram:numeric(2)representing the mz value range (min, max) on which the chromatogram was created. This is supposed to contain the real range of mz values in contrast tofilterMz. If not applicable usemzrange = c(0, 0).- filterMz
for
Chromatogram:numeric(2)representing the mz value range (min, max) that was used to filter the original object on m/z dimension. If not applicable usefilterMz = c(0, 0).- precursorMz
for
Chromatogram:numeric(2)for SRM/MRM transitions. Represents the mz of the precursor ion. See details for more information.- productMz
for
Chromatogram:numeric(2)for SRM/MRM transitions. Represents the mz of the product. See details for more information.- fromFile
for
Chromatogram:integer(1)the index of the file within theOnDiskMSnExporMSnExpfrom which the chromatogram was extracted.- aggregationFun
for
Chromatogram:characterstring specifying the function that was used to aggregate intensity values for the same retention time across the mz range. Supported are"sum"(total ion chromatogram),"max"(base peak chromatogram),"min"and"mean".- msLevel
for
Chromatogram:integer(1)with the MS level from which the chromatogram was extracted.- object
Chromatogramobject.- filter
for
mz:logical(1)defining whether the m/z range to filter the originating object (e.g.MSnExpobject) should be returned or the m/z range of the actual data. Defaults tofilter = FALSE.- x
Chromatogramobject.- rt
for
filterRt:numeric(2)defining the lower and upper retention time to which theChromatogramshould be subsetted.- all
for
clean:logical(1)whether all 0 intensities should be removed. Defaults toall = FALSE. Seeclean()for details.- na.rm
for
clean: if allNAintensities should be removed before cleaning theChromatogram. Defaults toclean = FALSE.- col
for
plot: the color to be used for plotting.- lty
for
plot: the line type. See help page ofplotin thegraphicspackage for details.- type
for
plot: the type of plot. See help page ofplotin thegraphicspackage for details.- xlab
for
plot: the x-axis label.- ylab
for
plot: the y-axis label.- main
for
plot: the plot title. If not provided the mz range will be used as plot title.- ...
for
plot: additional arguments to be passed to the baseplotfunction. ForfilterIntensity: additional parameters passed along to the function provided withintensity. ForcompareChromatograms: ignored- binSize
for
bin:numeric(1)with the size of the bins (in seconds). Defaults tobinSize = 0.5.- breaks
for
bin:numericdefining the bins. Usually not required as the function calculates the bins automatically based onbinSize.- fun
for
bin: function to be used to aggregate the intensity values falling within each bin. Defaults tofun = max.- method
character(1). Fornormalise: defining whether each chromatogram should be normalized to its maximum signal (method = "max") or total signal (method = "sum"). ForalignRt: aligning approach that should be used (see description). Defaults tomethod = "closest".- y
for
alignRt:Chromatogramagainst whichxshould be aligned against.- ALIGNFUN
for
compareChromatograms: function to align chromatogramxagainst chromatogramy. Defaults toalignRt.- ALIGNFUNARGS
listof parameters to be passed toALIGNFUN.- FUN
for
compareChromatograms: function to calculate a similarity score on the intensity values of the compared and aligned chromatograms. Defaults toFUN = cor. FortransformIntensity: function to transform chromatograms' intensity values. Defaults toFUN = identity.- FUNARGS
for
compareChromatograms:listwith additional parameters forFUN. Defaults toFUNARGS = list(use = "pairwise.complete.obs").
Details
The mz, filterMz, precursorMz and
productMz are stored as a numeric(2) representing a range
even if the chromatogram was generated for only a single ion (i.e. a
single mz value). Using ranges for mz values allow this class to
be used also for e.g. total ion chromatograms or base peak chromatograms.
Object creation
Chromatogram objects can be extracted from an MSnExp or OnDiskMSnExp
object with the chromatogram() function.
Alternatively, the constructor function Chromatogram can be used, which
takes arguments rtime, intensity, mz, filterMz, precursorMz,
productMz, fromFile, aggregationFun and msLevel.
Data access and coercion
aggregationFun: gets the aggregation function used to create theChromatogram.as.data.frame: returns adata.framewith columns"rtime"and"intensity".fromFile: returns aninteger(1)with the index of the originating file.intensity: returns the intensities from theChromatogram.isEmpty: returnsTRUEif the chromatogram is empty or has onlyNAintensities.length: returns the length (i.e. number of data points) of theChromatogram.msLevel: returns aninteger(1)with the MS level of the chromatogram.mz: get the m/z (range) from theChromatogram. The function returns anumeric(2)with the lower and upper boundaries. Parameterfilterallows to specify whether the m/z range used to filter the originating object should be returned or the m/z range of the actual data.precursorMz: get the m/z of the precursor ion. The function returns anumeric(2)with the lower and upper boundary.productMz: get the m/z of the producto chromatogram/ion. The function returns anumeric(2)with the lower and upper m/z value.rtime: returns the retention times from theChromatogram.
Data subsetting and filtering
filterRt: filter/subset theChromatogramto the specified retention time range (defined with parameterrt).filterIntensity: filter aChromatogram()object removing data points with intensities below a user provided threshold. Ifintensityis anumericvalue, the returned chromatogram will only contain data points with intensities >intensity. In addition it is possible to provide a function to perform the filtering. This function is expected to take the inputChromatogram(object) and to return a logical vector with the same length then there are data points inobjectwithTRUEfor data points that should be kept andFALSEfor data points that should be removed. See examples below.
Data processing and manipulation
alignRt: Aligns chromatogramxagainst chromatogramy. The resulting chromatogram has the same length (number of data points) thanyand the same retention times thus allowing to perform any pair-wise comparisons between the chromatograms. Ifxis aMChromatograms()object, eachChromatogramin it is aligned againsty. Additional parameters (...) are passed along to the alignment functions (e.g.closest()).Parameter
methodallows to specify which alignment method should be used. Currently there are the following options:method = "closest"(the default): match data points in the first chromatogram (x) to those of the second (y) based on the difference between their retention times: each data point inxis assigned to the data point inywith the smallest difference in their retention times if their difference is smaller than the minimum average difference between retention times inxory(parametertolerancefor the call to theclosest()function). By settingtolerance = 0only exact retention times are matched against each other (i.e. only values are kept with exactly the same retention times between both chromatograms).method = "approx": uses the base Rapproxfunction to approximate intensities inxto the retention times iny(using linear interpolation). This should only be used for chromatograms that were measured in the same measurement run (e.g. MS1 and corresponding MS2 chromatograms from SWATH experiments).
bin: aggregates intensity values from a chromatogram in discrete bins along the retention time axis and returns aChromatogramobject with the retention time representing the mid-point of the bins and the intensity the binned signal. ParametersbinSizeandbreaksallow to define the binning,funthe function which should be used to aggregate the intensities within a bin.compareChromatograms: calculates a similarity score between 2 chromatograms after aligning them. ParameterALIGNFUNallows to define a function that can be used to alignxagainsty(defaults toALIGNFUN = alignRt). Subsequently, the similarity is calculated on the aligned intensities with the function provided with parameterFUNwhich defaults tocor(hence by default the Pearson correlation is calculated between the aligned intensities of the two compared chromatograms). Additional parameters can be passed to theALIGNFUNandFUNwith the parameterALIGNFUNARGSandFUNARGS, respectively.clean: removes 0-intensity data points (andNAvalues). Seeclean()for details.normalize,normalise: normalises the intensities of a chromatogram by dividing them either by the maximum intensity (method = "max") or total intensity (method = "sum") of the chromatogram.transformIntensity: allows to manipulate the intensity values of a chromatogram using a user provided function. See below for examples.
See also
MChromatograms for combining Chromatogram in
a two-dimensional matrix (rows being mz-rt ranges, columns samples).
chromatogram()] for the method to extract chromatogram data from an MSnExporOnDiskMSnExpobject. [clean()] for the method to *clean* aChromatogram` object.
Examples
## Create a simple Chromatogram object.
ints <- abs(rnorm(100, sd = 100))
rts <- seq_len(length(ints))
chr <- Chromatogram(rtime = rts, intensity = ints)
chr
#> Object of class: Chromatogram
#> length of object: 100
#> from file:
#> mz range: [NA, NA]
#> rt range: [1, 100]
#> MS level: 1
## Extract intensities
intensity(chr)
#> [1] 140.0043517 25.5317055 243.7263611 0.5571287 62.1552721 114.8411606
#> [7] 182.1817661 24.7325302 24.4199607 28.2705449 55.3699384 62.8982042
#> [13] 206.5024895 163.0989402 51.2426950 186.3011492 52.2012515 5.2601910
#> [19] 54.2996343 91.4074827 46.8154420 36.2951256 130.4543545 73.7776321
#> [25] 188.8504929 9.7445104 93.5847354 1.5950311 82.6788954 151.2399651
#> [31] 93.5363190 17.6488611 24.3685465 162.3548883 11.2038083 13.3997013
#> [37] 191.0087468 27.9237242 31.3445978 106.7307879 7.0034850 63.9123324
#> [43] 4.9964899 25.1483443 44.4797116 275.5417575 4.6531380 57.7709069
#> [49] 11.8194874 191.1720491 86.2086482 24.3236740 20.6087195 1.9177592
#> [55] 2.9560754 54.9827542 227.4114857 268.2557184 36.1221255 21.3355750
#> [61] 107.4345882 66.5088249 111.3952419 24.5896412 117.7563309 97.5850616
#> [67] 106.5057320 13.1670635 48.8628809 169.9450568 147.0736306 28.4150344
#> [73] 133.7320413 23.6696283 131.8293384 52.3909788 60.6748047 10.9935672
#> [79] 17.2181715 9.0327287 192.4343341 129.8392759 74.8791268 55.6224329
#> [85] 54.8257264 111.0534893 261.2334333 15.5693776 43.3889790 38.1951112
#> [91] 42.4187575 106.3101996 104.8712620 3.8102895 48.6148920 167.2882611
#> [97] 35.4361164 94.6347886 131.6826356 29.6640025
## Extract retention times
rtime(chr)
#> [1] 1 2 3 4 5 6 7 8 9 10 11 12 13 14 15 16 17 18
#> [19] 19 20 21 22 23 24 25 26 27 28 29 30 31 32 33 34 35 36
#> [37] 37 38 39 40 41 42 43 44 45 46 47 48 49 50 51 52 53 54
#> [55] 55 56 57 58 59 60 61 62 63 64 65 66 67 68 69 70 71 72
#> [73] 73 74 75 76 77 78 79 80 81 82 83 84 85 86 87 88 89 90
#> [91] 91 92 93 94 95 96 97 98 99 100
## Extract the mz range - is NA for the present example
mz(chr)
#> [1] NA NA
## plot the Chromatogram
plot(chr)
 ## Create a simple Chromatogram object based on random values.
chr <- Chromatogram(intensity = abs(rnorm(1000, mean = 2000, sd = 200)),
rtime = sort(abs(rnorm(1000, mean = 10, sd = 5))))
chr
#> Object of class: Chromatogram
#> length of object: 1000
#> from file:
#> mz range: [NA, NA]
#> rt range: [0.002530252, 23.75382]
#> MS level: 1
## Get the intensities
head(intensity(chr))
#> [1] 1658.884 1828.917 1971.020 1935.111 1965.487 1752.787
## Get the retention time
head(rtime(chr))
#> [1] 0.002530252 0.004804333 0.086750187 0.102224373 0.114592272 0.155135059
## What is the retention time range of the object?
range(rtime(chr))
#> [1] 0.002530252 23.753823765
## Filter the chromatogram to keep only values between 4 and 10 seconds
chr2 <- filterRt(chr, rt = c(4, 10))
range(rtime(chr2))
#> [1] 4.031794 9.975626
## Data manipulations:
## normalize a chromatogram
par(mfrow = c(1, 2))
plot(chr)
plot(normalize(chr, method = "max"))
## Create a simple Chromatogram object based on random values.
chr <- Chromatogram(intensity = abs(rnorm(1000, mean = 2000, sd = 200)),
rtime = sort(abs(rnorm(1000, mean = 10, sd = 5))))
chr
#> Object of class: Chromatogram
#> length of object: 1000
#> from file:
#> mz range: [NA, NA]
#> rt range: [0.002530252, 23.75382]
#> MS level: 1
## Get the intensities
head(intensity(chr))
#> [1] 1658.884 1828.917 1971.020 1935.111 1965.487 1752.787
## Get the retention time
head(rtime(chr))
#> [1] 0.002530252 0.004804333 0.086750187 0.102224373 0.114592272 0.155135059
## What is the retention time range of the object?
range(rtime(chr))
#> [1] 0.002530252 23.753823765
## Filter the chromatogram to keep only values between 4 and 10 seconds
chr2 <- filterRt(chr, rt = c(4, 10))
range(rtime(chr2))
#> [1] 4.031794 9.975626
## Data manipulations:
## normalize a chromatogram
par(mfrow = c(1, 2))
plot(chr)
plot(normalize(chr, method = "max"))
 ## Align chromatograms against each other
chr1 <- Chromatogram(rtime = c(1, 2, 3, 4, 5, 6, 7, 8, 9, 10),
intensity = c(3, 5, 14, 30, 24, 6, 2, 1, 1, 0))
chr2 <- Chromatogram(rtime = c(2.5, 3.42, 4.5, 5.43, 6.5),
intensity = c(5, 12, 15, 11, 5))
plot(chr1, col = "black")
points(rtime(chr2), intensity(chr2), col = "blue", type = "l")
## Align chr2 to chr1 without interpolation
res <- alignRt(chr2, chr1)
rtime(res)
#> [1] 1 2 3 4 5 6 7 8 9 10
intensity(res)
#> [1] NA 5 12 15 11 5 NA NA NA NA
points(rtime(res), intensity(res), col = "#00ff0080", type = "l")
## Align chr2 to chr1 with interpolation
res <- alignRt(chr2, chr1, method = "approx")
points(rtime(res), intensity(res), col = "#ff000080", type = "l")
legend("topright", col = c("black", "blue", "#00ff0080","#ff000080"),lty = 1,
legend = c("chr1", "chr2", "chr2 matchRtime", "chr2 approx"))
## Compare Chromatograms. Align chromatograms with `alignRt` and
## method `"approx"`
compareChromatograms(chr2, chr1, ALIGNFUNARGS = list(method = "approx"))
#> [1] 0.9768469
## Data filtering
chr1 <- Chromatogram(rtime = c(1, 2, 3, 4, 5, 6, 7, 8, 9, 10),
intensity = c(3, 5, 14, 30, 24, 6, 2, 1, 1, 0))
## Remove data points with intensities below 10
res <- filterIntensity(chr1, 10)
intensity(res)
#> [1] 14 30 24
## Remove data points with an intensity lower than 10% of the maximum
## intensity in the Chromatogram
filt_fun <- function(x, prop = 0.1) {
x@intensity >= max(x@intensity, na.rm = TRUE) * prop
}
res <- filterIntensity(chr1, filt_fun)
intensity(res)
#> [1] 3 5 14 30 24 6
## Remove data points with an intensity lower than half of the maximum
res <- filterIntensity(chr1, filt_fun, prop = 0.5)
intensity(res)
#> [1] 30 24
## log2 transform intensity values
res <- transformIntensity(chr1, log2)
intensity(res)
#> [1] 1.584963 2.321928 3.807355 4.906891 4.584963 2.584963 1.000000 0.000000
#> [9] 0.000000 -Inf
log2(intensity(chr1))
#> [1] 1.584963 2.321928 3.807355 4.906891 4.584963 2.584963 1.000000 0.000000
#> [9] 0.000000 -Inf
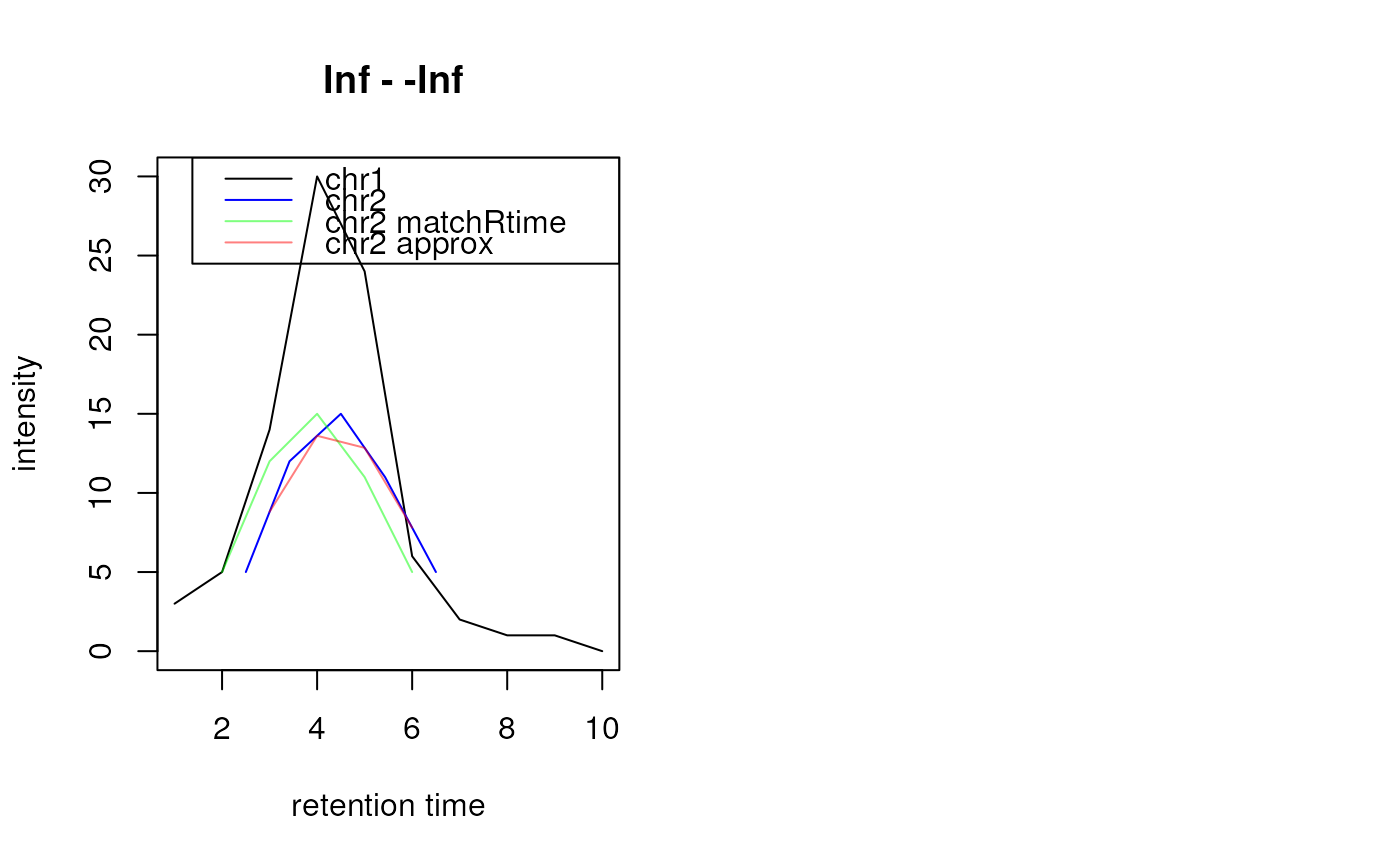
## Align chromatograms against each other
chr1 <- Chromatogram(rtime = c(1, 2, 3, 4, 5, 6, 7, 8, 9, 10),
intensity = c(3, 5, 14, 30, 24, 6, 2, 1, 1, 0))
chr2 <- Chromatogram(rtime = c(2.5, 3.42, 4.5, 5.43, 6.5),
intensity = c(5, 12, 15, 11, 5))
plot(chr1, col = "black")
points(rtime(chr2), intensity(chr2), col = "blue", type = "l")
## Align chr2 to chr1 without interpolation
res <- alignRt(chr2, chr1)
rtime(res)
#> [1] 1 2 3 4 5 6 7 8 9 10
intensity(res)
#> [1] NA 5 12 15 11 5 NA NA NA NA
points(rtime(res), intensity(res), col = "#00ff0080", type = "l")
## Align chr2 to chr1 with interpolation
res <- alignRt(chr2, chr1, method = "approx")
points(rtime(res), intensity(res), col = "#ff000080", type = "l")
legend("topright", col = c("black", "blue", "#00ff0080","#ff000080"),lty = 1,
legend = c("chr1", "chr2", "chr2 matchRtime", "chr2 approx"))
## Compare Chromatograms. Align chromatograms with `alignRt` and
## method `"approx"`
compareChromatograms(chr2, chr1, ALIGNFUNARGS = list(method = "approx"))
#> [1] 0.9768469
## Data filtering
chr1 <- Chromatogram(rtime = c(1, 2, 3, 4, 5, 6, 7, 8, 9, 10),
intensity = c(3, 5, 14, 30, 24, 6, 2, 1, 1, 0))
## Remove data points with intensities below 10
res <- filterIntensity(chr1, 10)
intensity(res)
#> [1] 14 30 24
## Remove data points with an intensity lower than 10% of the maximum
## intensity in the Chromatogram
filt_fun <- function(x, prop = 0.1) {
x@intensity >= max(x@intensity, na.rm = TRUE) * prop
}
res <- filterIntensity(chr1, filt_fun)
intensity(res)
#> [1] 3 5 14 30 24 6
## Remove data points with an intensity lower than half of the maximum
res <- filterIntensity(chr1, filt_fun, prop = 0.5)
intensity(res)
#> [1] 30 24
## log2 transform intensity values
res <- transformIntensity(chr1, log2)
intensity(res)
#> [1] 1.584963 2.321928 3.807355 4.906891 4.584963 2.584963 1.000000 0.000000
#> [9] 0.000000 -Inf
log2(intensity(chr1))
#> [1] 1.584963 2.321928 3.807355 4.906891 4.584963 2.584963 1.000000 0.000000
#> [9] 0.000000 -Inf