The curse of dimensionality
Introduction
Based on Peter Norvigs’s MSRI talk What to demand from a Scientific Computing Language (22:50): ‘if you have high dimensional data, then almost all the data are outliers’. He showed a very elegant piece of python code to illustrate it; below is an R implementation.
Implementation
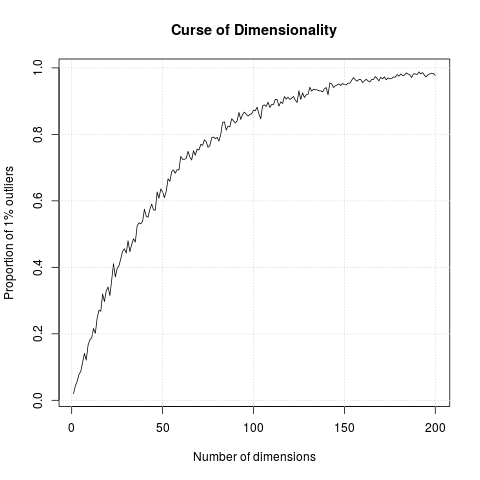
The simulation generates N points in hypercubes of d dimensions
and counts how many of those points are outliers, defined as being in
the 1% outer shell of the space. In 1 dimension, we have 1% of the
uniformely distributed points that are outliers. In 50 dimension,
there are already 60% of the points that are outliers; in 100
dimensions, almost 90% of the points are outliers.
Result