Chapter 3 Exploring and visualising biomolecular data
This chapter provides an overview of a typical omics data analysis, exploration of the data, statistical analysis and their associated visualisations. We will look into the respective figures and how to produce them in the later chapters.
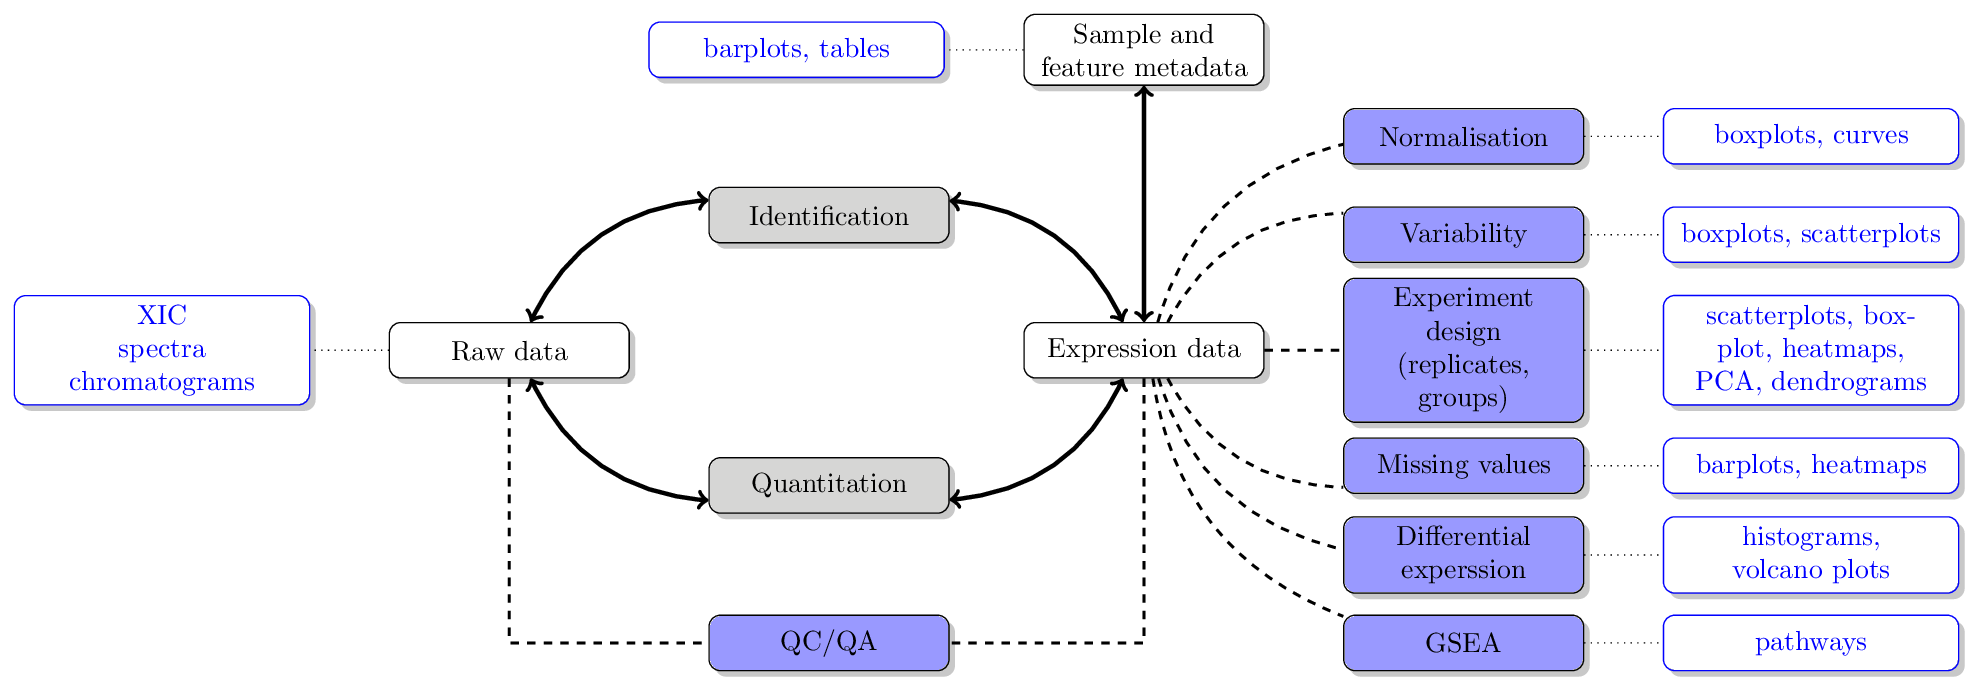
A typical proteomics data processing and analysis workflow
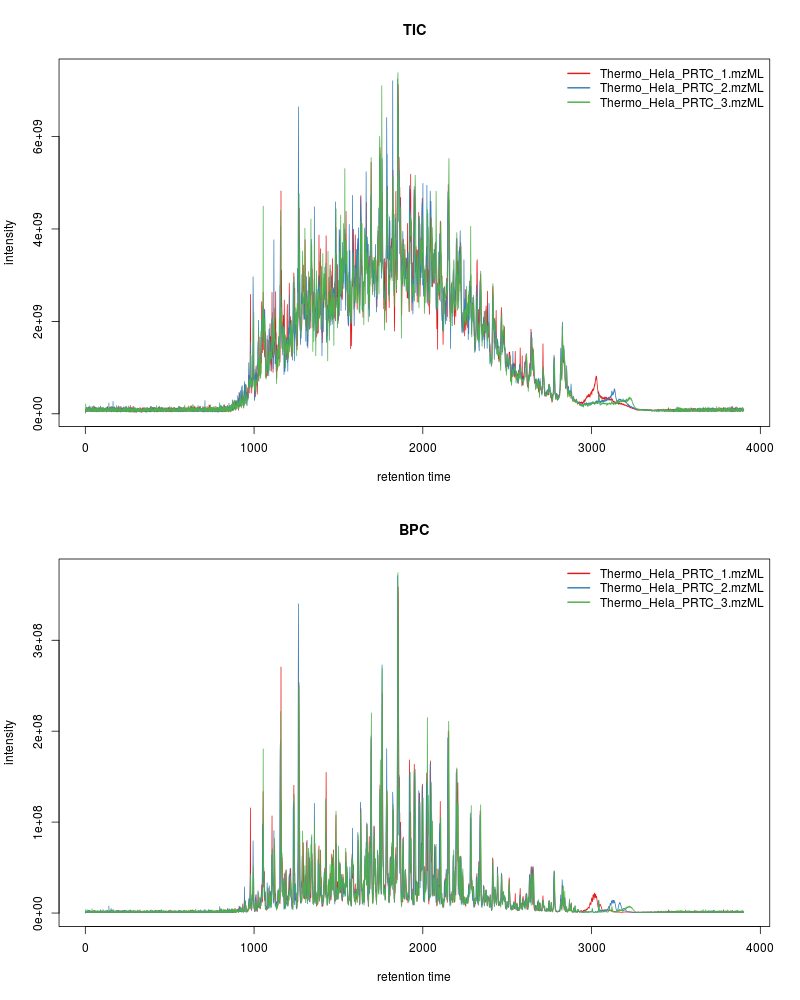
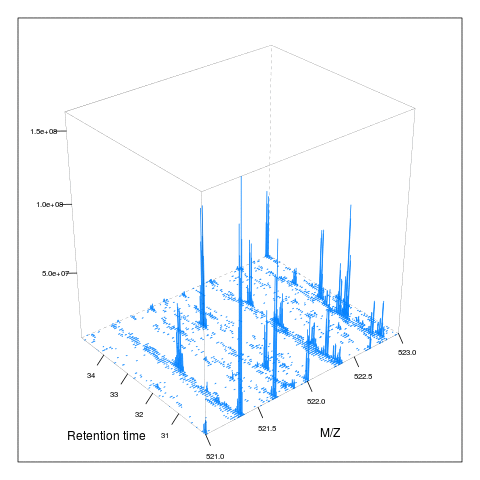
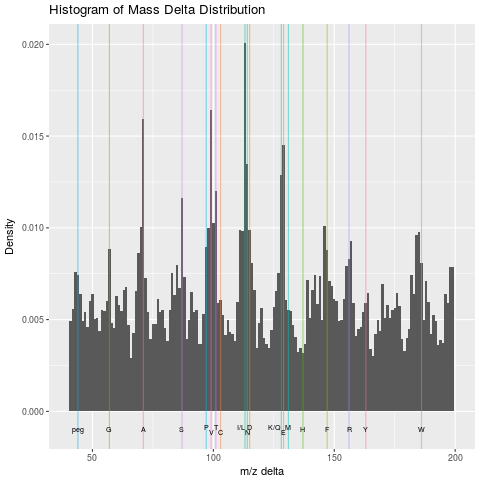
Raw data

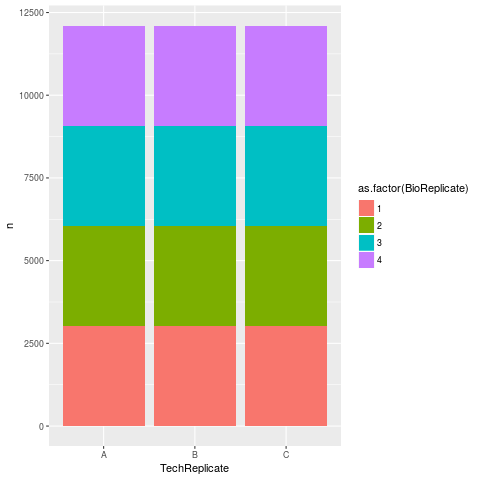
Exploring the experimental design
table(cut(crc$Age, 5), crc$Gender)##
## female male
## (32.9,44.6] 3 2
## (44.6,56.2] 19 14
## (56.2,67.8] 34 59
## (67.8,79.4] 28 28
## (79.4,91.1] 10 3## `stat_bin()` using `bins = 30`. Pick better value with `binwidth`.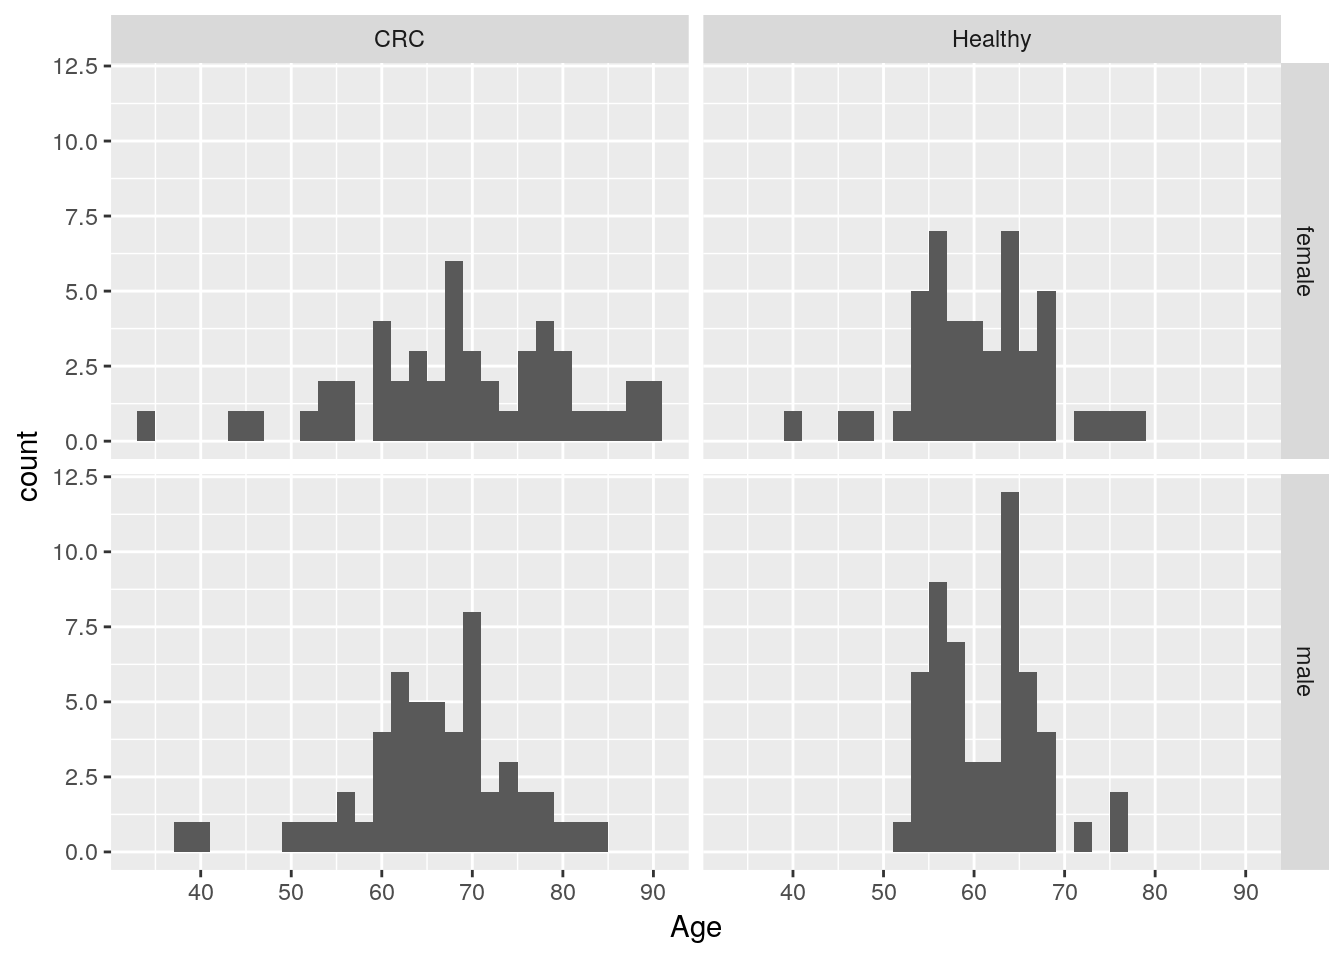
Quantitative data
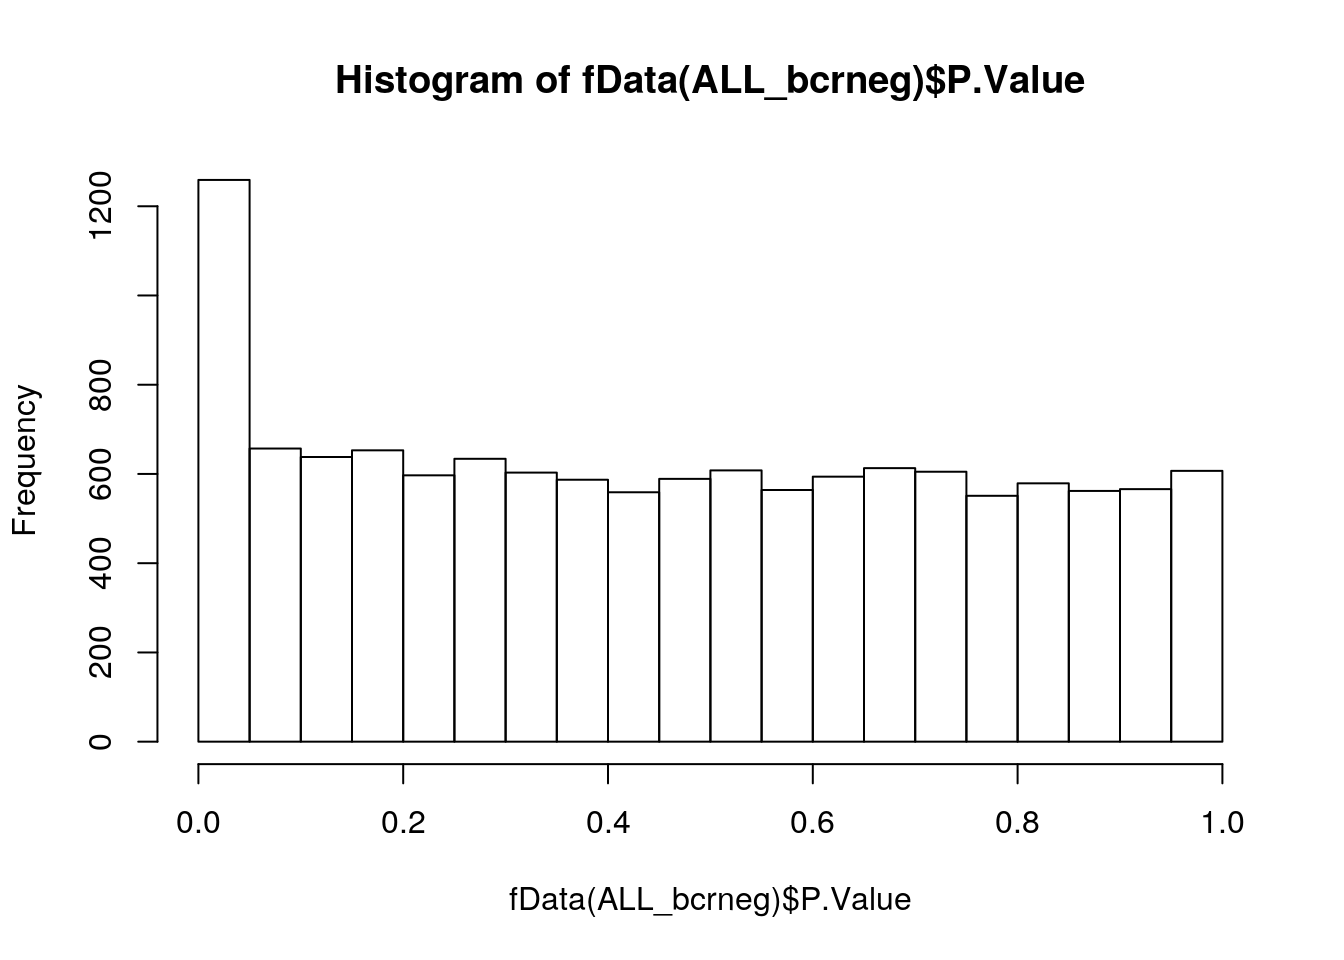
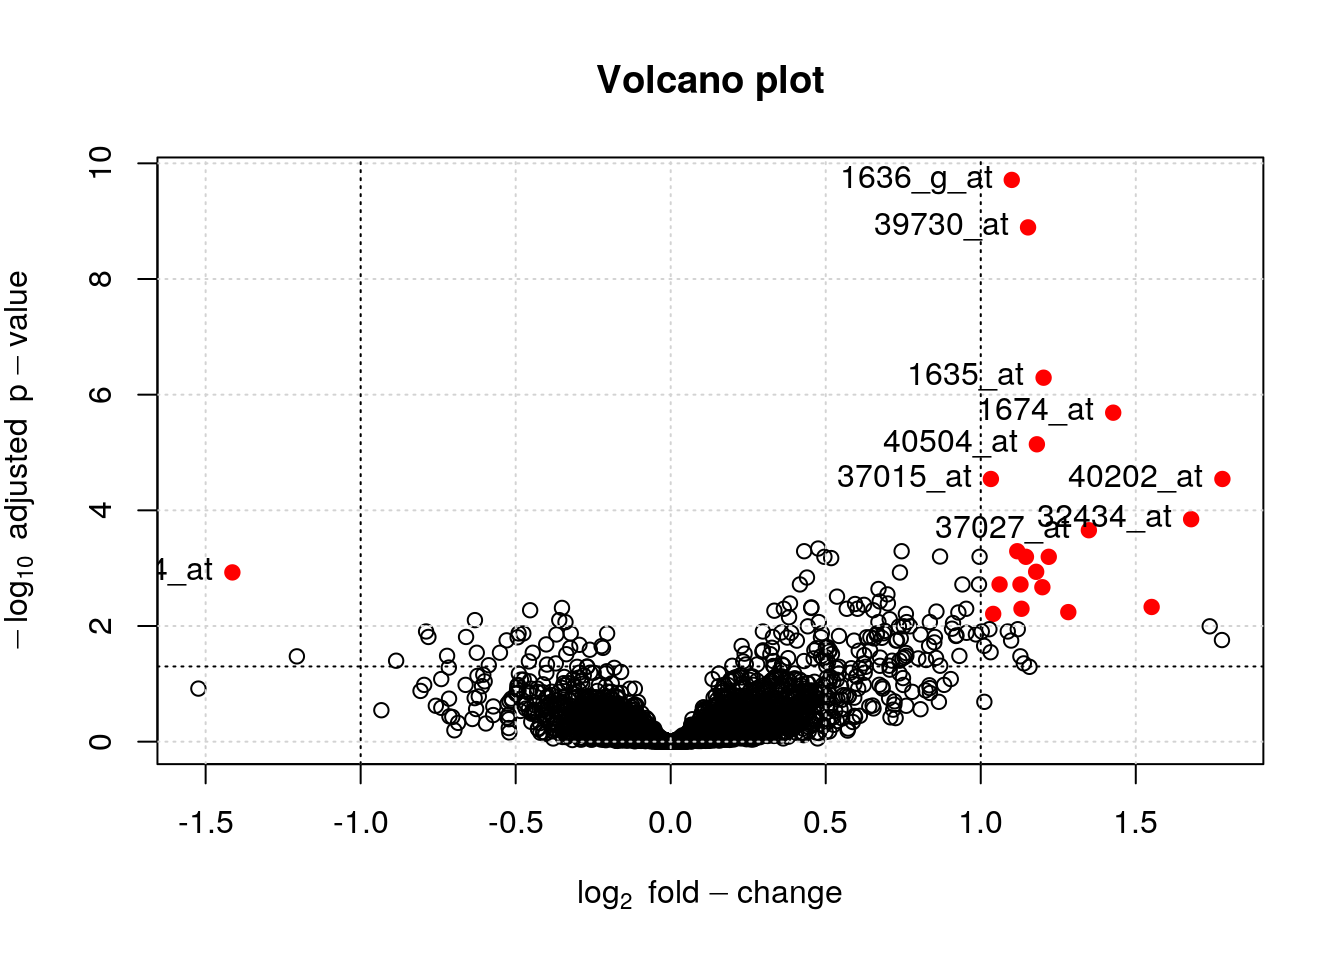
Differential expression