Storing multiple ClustDist instances
ClustDistList-class.RdA class for storing lists of ClustDist
instances.
Slots
x:Object of class
listcontaining validClustDistinstances.log:Object of class
listcontaining an object creation log, containing among other elements the call that generated the object..__classVersion__:The version of the instance. For development purposes only.
Methods
"[["Extracts a single
ClustDistat position."["Extracts one of more
ClustDistsasClustDistList.lengthReturns the number of
ClustDists.namesReturns the names of
ClustDists, if available. The replacement method is also available.showDisplay the object by printing a short summary.
lapply(x, FUN, ...)Apply function
FUNto each element of the inputx. If the application ofFUNreturns andClustDist, then the return value is anClustDistList, otherwise alist
.
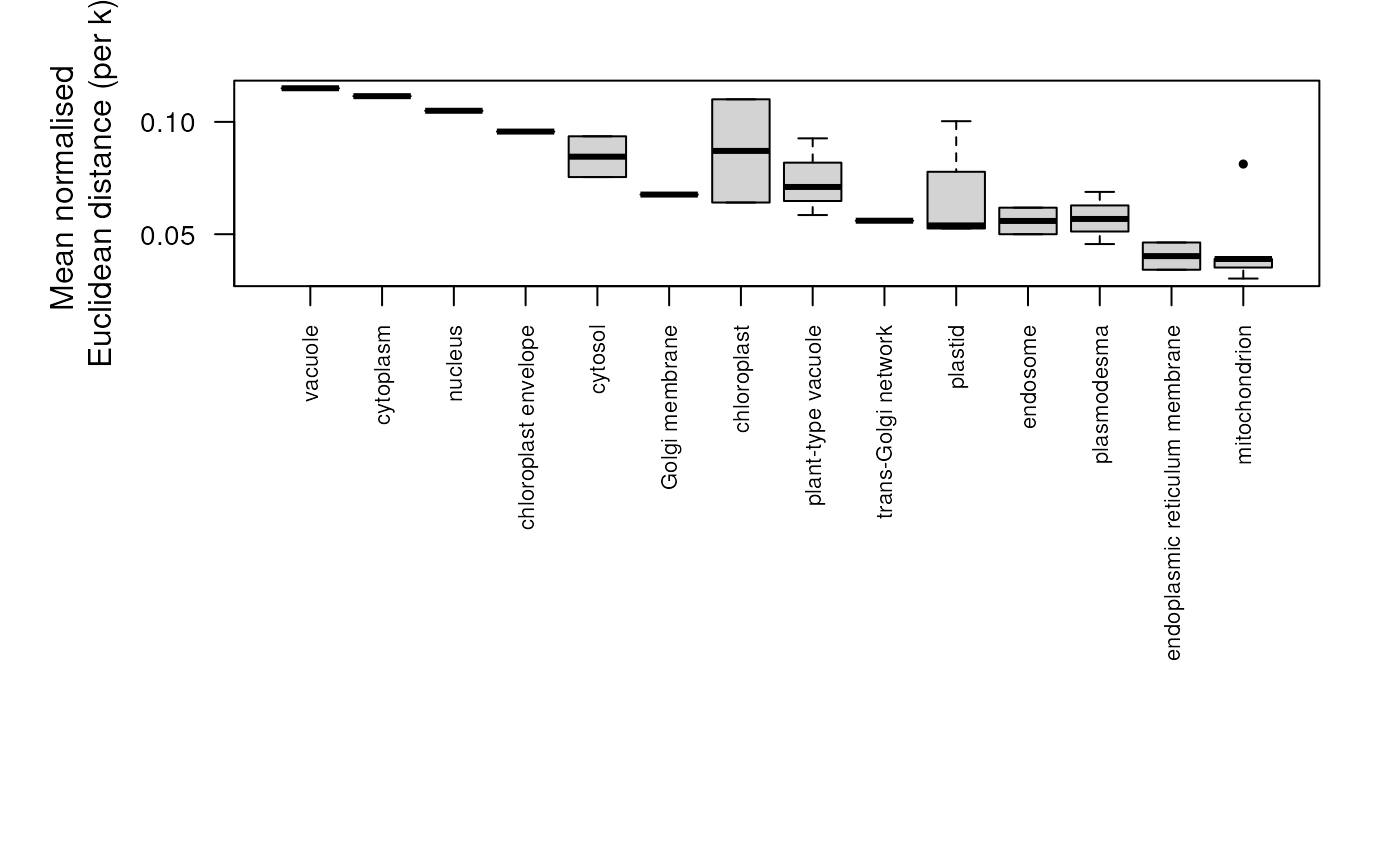
plotPlots a boxplot of the distance results per protein set.
Examples
  library('pRolocdata')
  data(dunkley2006)
  par <- setAnnotationParams(inputs =
                    c("Arabidopsis thaliana genes",
                    "Gene stable ID"))
#> Using species Arabidopsis thaliana genes (TAIR10)
#> Warning: Ensembl will soon enforce the use of https.
#> Ensure the 'host' argument includes "https://"
#> Using feature type Gene stable ID(s) [e.g. AT1G01010]
#> Connecting to Biomart...
#> Warning: Ensembl will soon enforce the use of https.
#> Ensure the 'host' argument includes "https://"

  ## add protein set/annotation information
  xx <- addGoAnnotations(dunkley2006, par)

  ## filter
  xx <- filterMinMarkers(xx, n = 50)
#> Retaining 3 out of 79 in GOAnnotations
  xx <- filterMaxMarkers(xx, p = .25)
#> Retaining 2 out of 3 in GOAnnotations

  ## get distances for protein sets
  dd <- clustDist(xx)
#>
  |
  |                                                                      |   0%
  |
  |===================================                                   |  50%
  |
  |======================================================================| 100%

  ## plot distances for all protein sets
  plot(dd)


  names(dd)
#> [1] "endoplasmic reticulum" "Golgi apparatus"

  ## Extract a sub-list of ClustDist objects
  dd[1]
#> Instance of class 'ClustDistList' containig 1 objects.

  ## Extract 1st ClustDist object
  dd[[1]]
#> Object of class "ClustDist"
#> fcol =  GOAnnotations
#>  term =  GO:0005783
#>  id =  endoplasmic reticulum
#>  nrow =  91
#> k's tested: 1 2 3 4 5
#>   Size:  91
#>   Size:  88
#>   Size:  80
#>   Size:  NA
#>   Size:  NA
#> Clusters info:
#>       ks.mean    mean ks.norm     norm
#> k = 1       1  0.1916       1  0.04260
#> k = 2       1  0.1595       1  0.03585
#> k = 3       1 *0.1385       1 *0.03215
#> k = 4      NA      NA      NA       NA
#> k = 5      NA      NA      NA       NA
names(dd)
#> [1] "endoplasmic reticulum" "Golgi apparatus"
## Extract a sub-list of ClustDist objects
dd[1]
#> Instance of class 'ClustDistList' containig 1 objects.
## Extract 1st ClustDist object
dd[[1]]
#> Object of class "ClustDist"
#> fcol = GOAnnotations
#> term = GO:0005783
#> id = endoplasmic reticulum
#> nrow = 91
#> k's tested: 1 2 3 4 5
#> Size: 91
#> Size: 88
#> Size: 80
#> Size: NA
#> Size: NA
#> Clusters info:
#> ks.mean mean ks.norm norm
#> k = 1 1 0.1916 1 0.04260
#> k = 2 1 0.1595 1 0.03585
#> k = 3 1 *0.1385 1 *0.03215
#> k = 4 NA NA NA NA
#> k = 5 NA NA NA NA