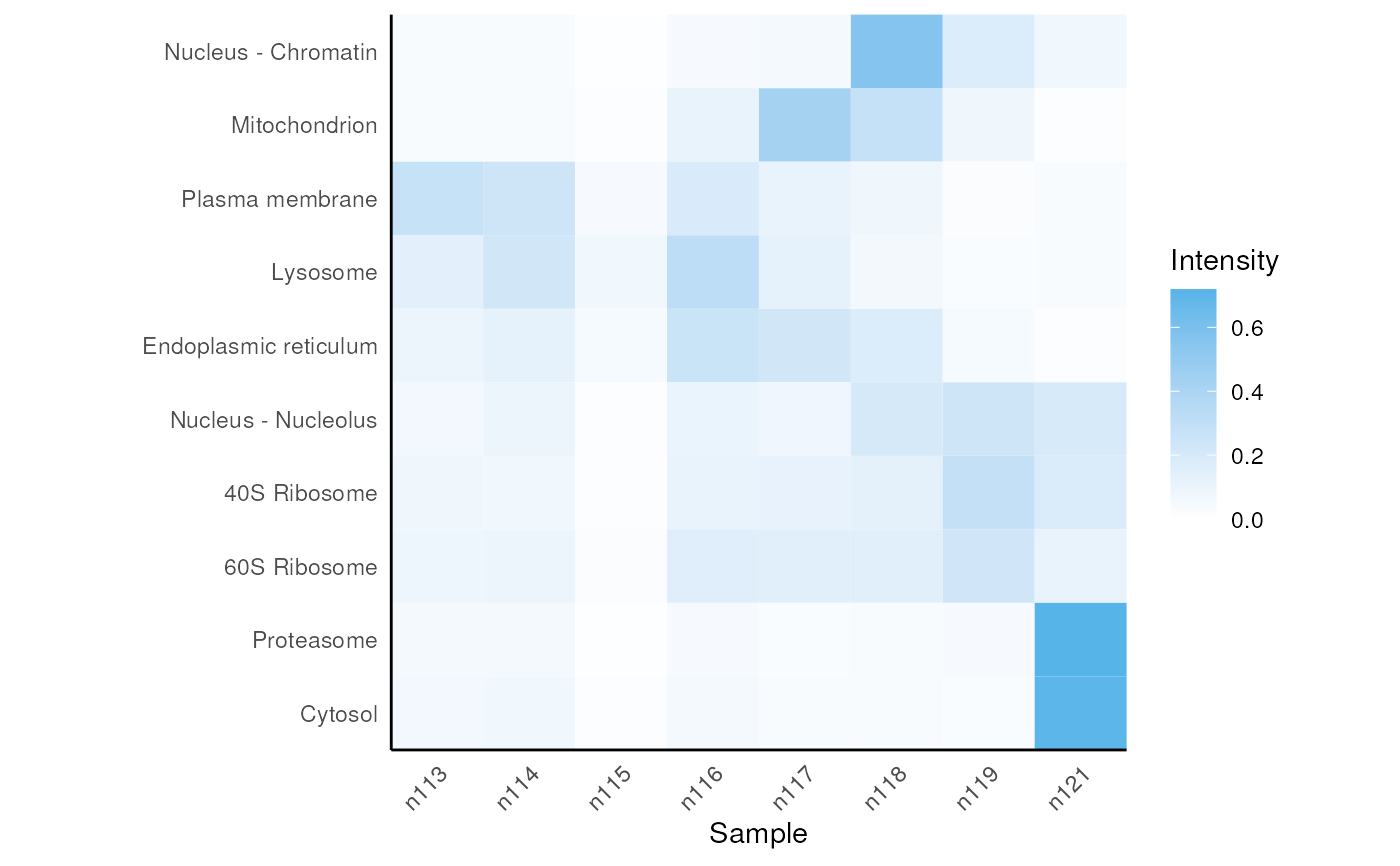
The function plots marker consensus profiles obtained from mrkConsProfile
Arguments
- object
A
matrixcontaining marker consensus profiles as output frommrkConsProfiles().- order
Order for markers (optional).
- plot
A
logical(1)defining whether the heatmap should be plotted. Default isTRUE.
Examples
library("pRolocdata")
data(E14TG2aS1)
hc <- mrkHClust(E14TG2aS1, plot = FALSE)
mm <- getMarkerClasses(E14TG2aS1)
ord <- levels(factor(mm))[order.dendrogram(hc)]
fmat <- mrkConsProfiles(E14TG2aS1)
plotConsProfiles(fmat, order = ord)