Standardised and reproducible analysis of mass spectrometry-based single-cell proteomics data
We are excited to anounce the official release of the
scp
package. scp has been accepted in Bioconductor and
published
as its first stable release (version 1.0) on the 28 October. We
present here a transcript of a recent talk Christophe Vanderaa and
Laurent Gatto gave at the SCP2020
conference.
The images in this post were taken from our slides
Introduction
Mass spectrometry-based single cell proteomics is a young and exciting field that comes with many challenges. Great progress has been made in recent years, and this conference is a hallmark of its success and promises. In this presentation, we, that is Christophe Vanderaa and myself, would like to share our efforts in proposing an infrastructure for standardised and reproducible analysis of such data. We will illustrate this infrastructure by presenting a replication of the recent SCoPE2 data by Harrison Specht et al.
The value of replication
We will focus here on computational replication, starting from the low-level (PSM) quantitation data. We will posit that results that can be reproduced are more trustable.
- Expectation: the processing and analysis of data leads to results and discoveries
- Reality: many steps of the analysis pipeline can go wrong leading to inaccurate, misleading, wrong results.
A pipeline that can’t be reproduced is a pipeline that is ill defined, that leads, mostly, to false discoveries. Of course, replication isn’t a guarantee for accuracy, but an analysis that can’t be replicated is one that can’t be trusted.
Replication is a first step towards a trustworthy and shareable process. The development of non-trivial software tools isn’t done out of the blue, in isolation. Ideally, it is a collaboration between the developer, the data producer and the user. In other words Replication- or Reproduction-based development is an efficient approach to tool development.
Replication is of course only the first step to define sound data infrastructure and principled analysis.
Why SCoPE2
The goal is not to focus on one type of single cell data exclusively. Indeed, many of the processing steps that will be mentioned are ubiquitous in quantitative data processing.
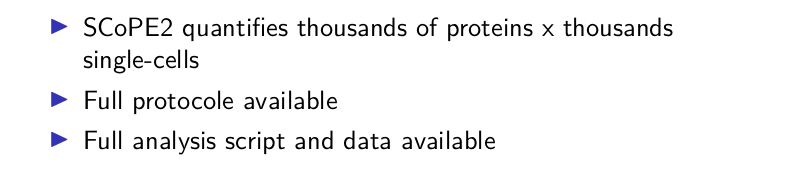
SCoPE2 offered an ideal reproduction-based development use case: full protocol, data and analysis scripts are available, plus support from the authors.
Our objectives
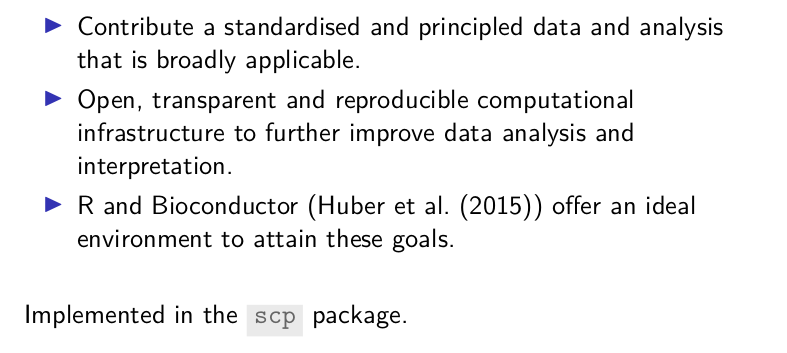
- Contribute a standardised and principled data and analysis that is broadly applicable, i.e. to any MS-based single cell proteomics data.
- Open, transparent and reproducible computational infrastructure that can be leveraged to further improve data analysis and interpretation.
- R and Bioconductor offer an ideal environment for this.
scp package
Data infrastructure
QFeatures
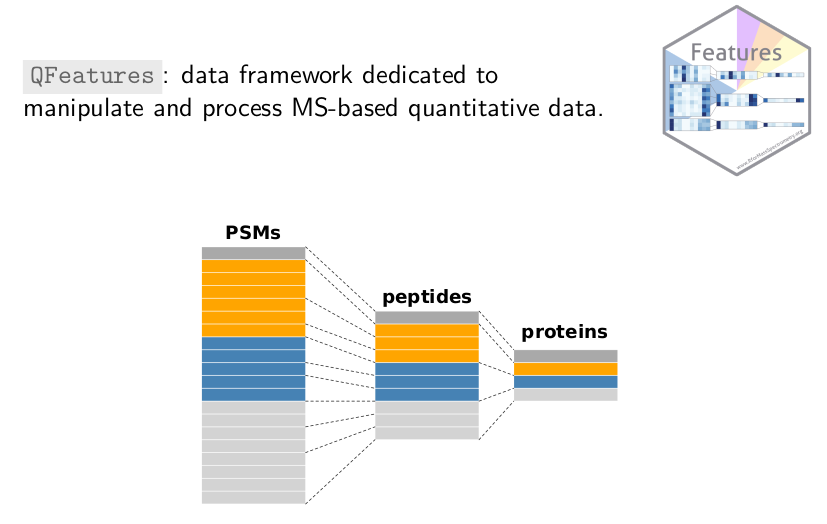
QFeatures
(also recently accepted in Bioconductor) is a general infrastructure
(i.e. not specifically for MS-based single cell data) to manipulate
quantitative data from MS experiments. Proteomics data is multi-level:
data is acquired at the (low) spectrum level and protein-level data is
progressively built up through multiple processing steps. The goal of
QFeatures is to explicitly record the successive steps so as to
allow users to navigate up and down these different levels.
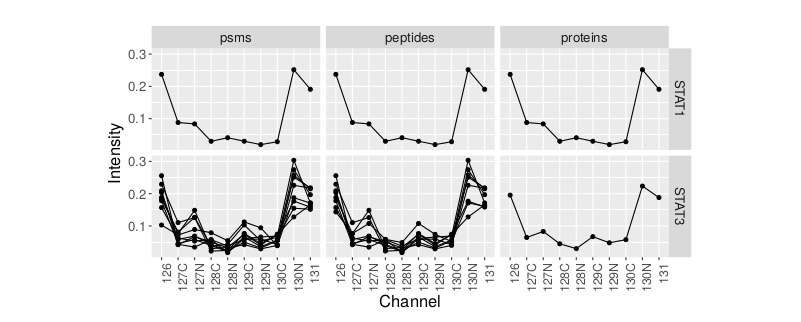
The following example illustrates what this means using a real data example. At the end of an analysis pipeline, it is easy to check any proteins, here STAT1 and STAT3, and verify the summarised expression profiles at the protein level, the expression profiles and the peptides level or at the spectrum level for labelled MS2 methods. Here, we can immediately visualise that the former is composed of a single PSM/peptide, while the other displays a more coherent profile for 10 PSMs/9 peptides.
SingleCellExperiment
The scp package also relies on the work of colleagues working on
single cell RNA sequencing, in particular on the
SingleCellExperiment
package. The figure here represents how the SingleCellExperiment data
class captures single cell RNASeq data, which of course also fit single
cell proteomics data.
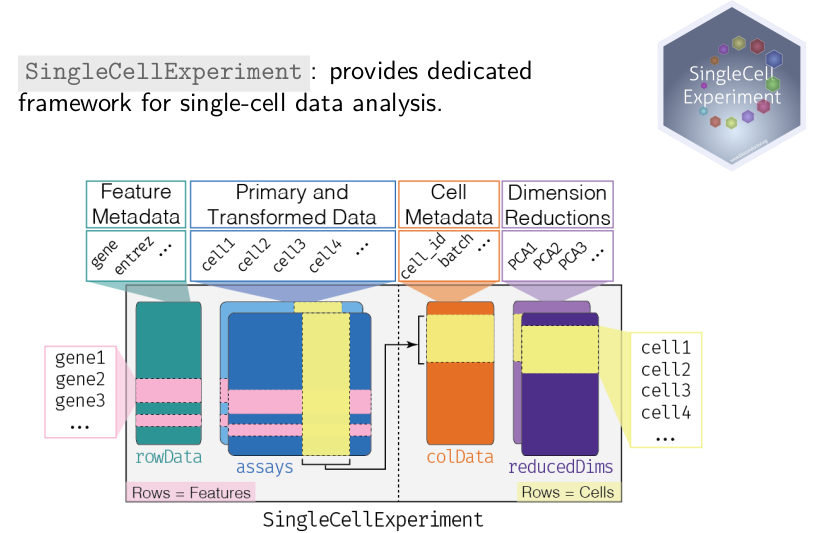
Such an experiment is composed of primary and transformed quantitative data, with genes/peptides/proteins along the rows and cells along the columns.
- A table that captures metadata along the rows.
- A table that captures metadata along the columns.
An additional slot to store data from various dimensionality reduction techniques, an important and widely used tool in single cell data analysis.
scp
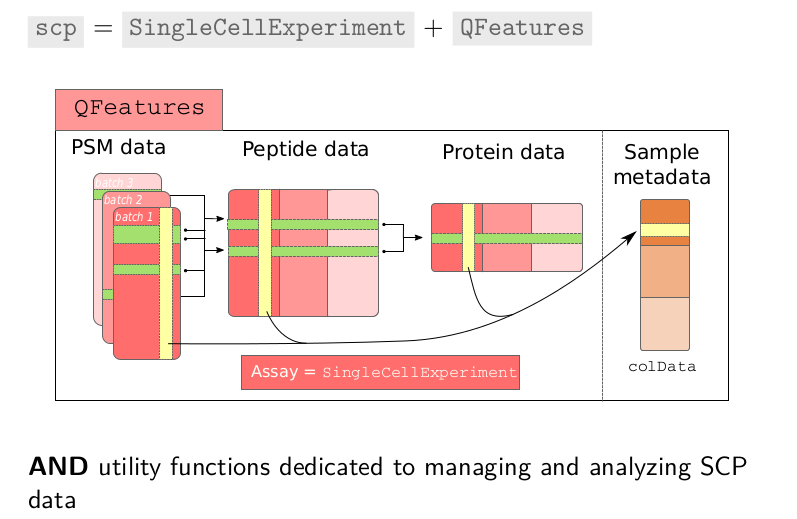
The scp
package relies on these two pieces of software,
SingleCellExperiment to individually handle PSM, peptide and protein
level data, that are all, collectively linked and managed by
QFeatures. In addition, and most importantly, scp offers the function
to process and analyse the single cell proteomics data.
Load data
To start the replication, we have formatted the supplementary data
from the SCoPE2 preprint using the scp infrastructure that was
just introduced. The dataset is stored in a data package called
scpdata. So, we load scpdata and fetch the dataset that we called
specht2019v2.
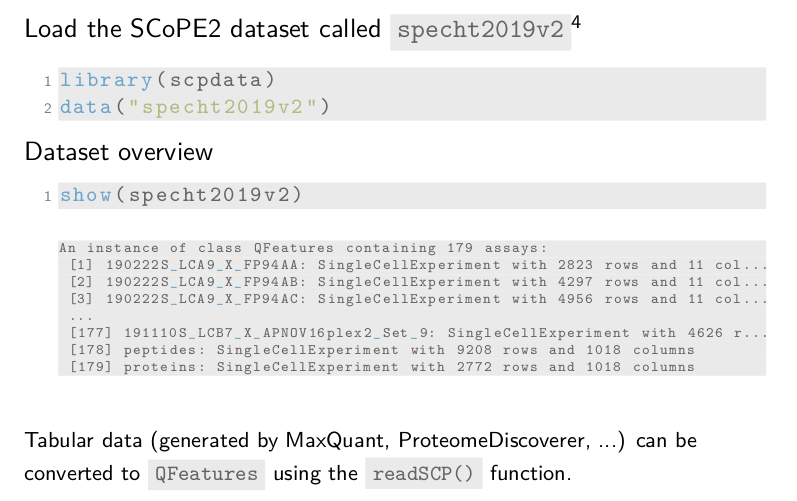
The show method gives a compact overview of the data object. The
header indicates the dataset is a QFeatures object and it contains
179 assays. Remember, each assay within the dataset is stored
as a SingleCellExperiment object. Assays 1 to 177 contain the
quantitative PSM data and metadata for the different SCoPE2 sets. They
contain either 11 or 16 columns, depending on whether the TMT-11 or 16
protocol was used. The before last assay contains the peptide data for
all sets. The last assay is the protein data assay.
The tabular data generated by MaxQuant or Proteome Discoverer can
easily be converted to a QFeatures object using our readSCP
function.
Metadata
The sample metadata that is common to all assays are stored in a
single table called the colData where each row represents a sample
in one of the assays and the columns are the metadata fields. In this
example, the Set field gives the name of the SCoPE2 set, Channel
in which channel the sample was acquired, SampleType the type of
sample, lcbatch the chromatographic batch, etc.
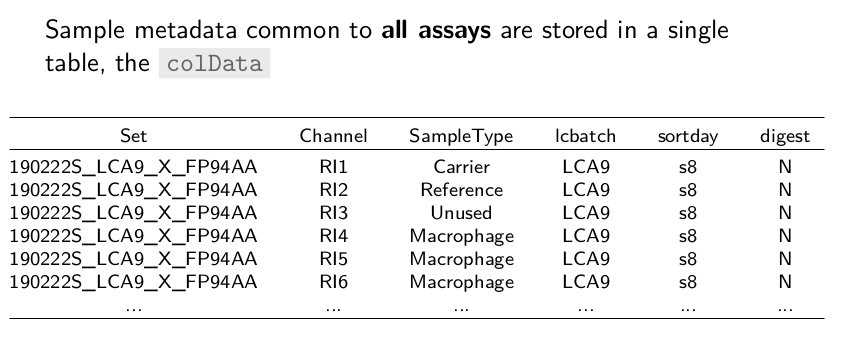
So, all useful information is contained in a single object, ready for processing.
Analysis workflow
The SCoPE2 analysis is composed of a series of data processing steps and I just mentioned loading the data. We start the workflow with PSM level data acquired over 177 different sets.
These data will go through feature filtering, division of expression channel by the reference channel, aggregating the data to peptides, combine the different sets in one, single-cell filtering, normalization, removal of highly missing peptides, and log-transformation. After these steps, we get the peptide data that is provided in the preprint.
The peptides are then aggregated to proteins, normalized, imputed and batch corrected to get the processed protein data from the article.
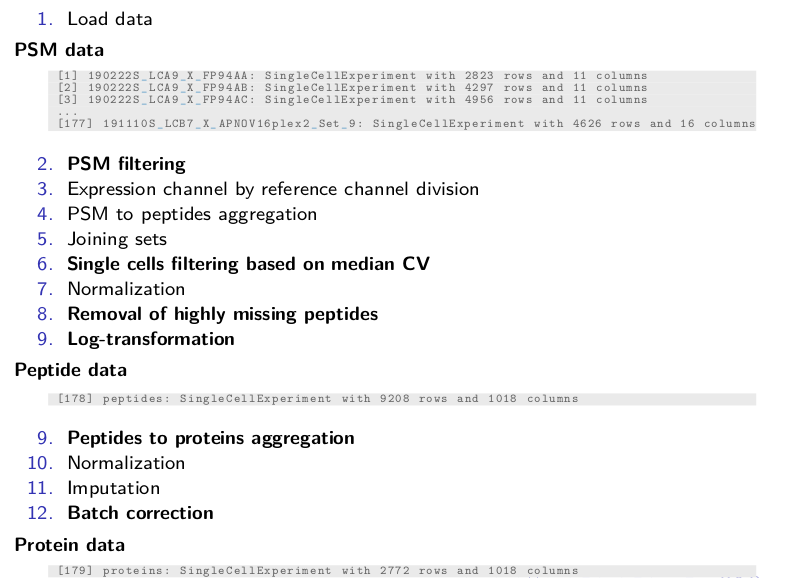
We will not cover all steps but focus on a few representative ones.
scp showcase
Let’s see how it works
PSM filtering
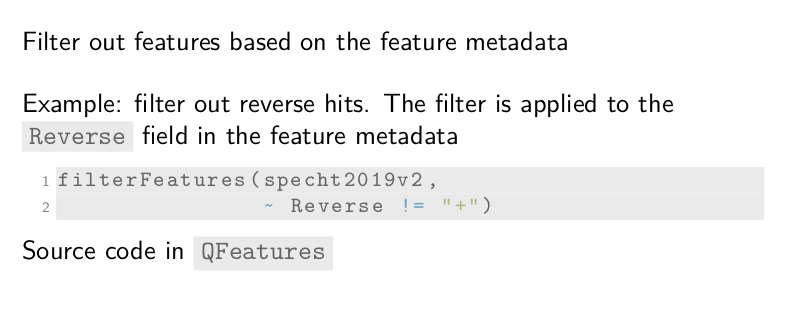
One common functionality is to remove low-confidence features based on the metadata stored along with the dataset.
For example, we want to remove PSMs that are matched to the reversed
database that serves as a decoy database. This information was already
generated by MaxQuant and is stored in the Reverse field of the
metadata. The filterFeatures function takes our dataset and a
filtering condition. In this case, the features for which Reverse is
not positive. The function then returns the dataset containing only
PSM that passed the condition. This is done automatically for all 177
PSM-level assays.
Data filtering: compute QC metrics
Of course, some QC metrics might be specific to single-cell proteomics and are not computed by MaxQuant. For instance, SCoPE2 computes a sample to carrier ratio to discard samples with intensities higher than it would be expected. It also computes peptide FDR, the expected proportion of features that are wrongly assigned to a given peptide. Another example is to filter single-cells based on the median coefficient of variation that indicates the reliability of the protein quantification.
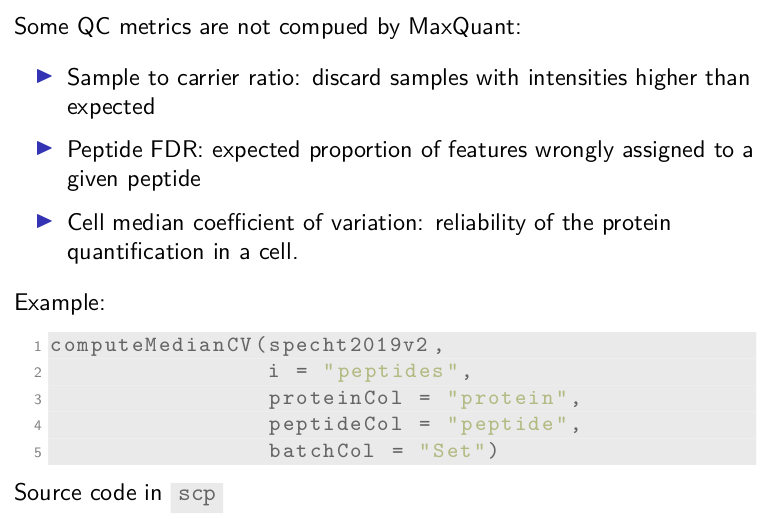
We provide the functionality to compute those three metrics. See here,
computeMedianCV takes the dataset, the name of the assay from which
the median CVs should be computed, here peptides, and the names of
the metadata fields that hold the required information for computing
the CV.
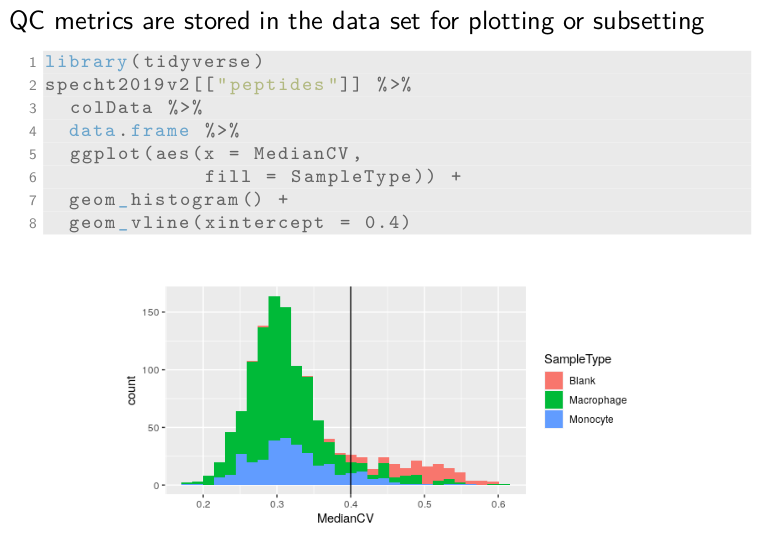
Data filtering: plot QC metrics
The computed CVs are stored in a new metadata field called medianCV
and allows for easy plotting and subsetting of the data. Let’s plot
the CVs. First, we retrieve the assay peptides in which the CVs were
stored. Then we get the colData where the medianCV is stored and
format it to a data.frame for plotting. The remainder of the code is
creating the histogram using ggplot2. We can see here that blank
samples exhibit much higher CVs than the single-cells and the black
line shows the cutoff used in SCoPE2 for filtering cells.
Feature aggregation
Next, feature aggregation allows combining features into a higher-level structure. For example, multiple peptides can be aggregated to a single protein. This functionality includes 2 steps. First, we combine the quantitative data from multiple peptides to a single protein. Second, we store the relationship from the aggregated peptides to the protein.
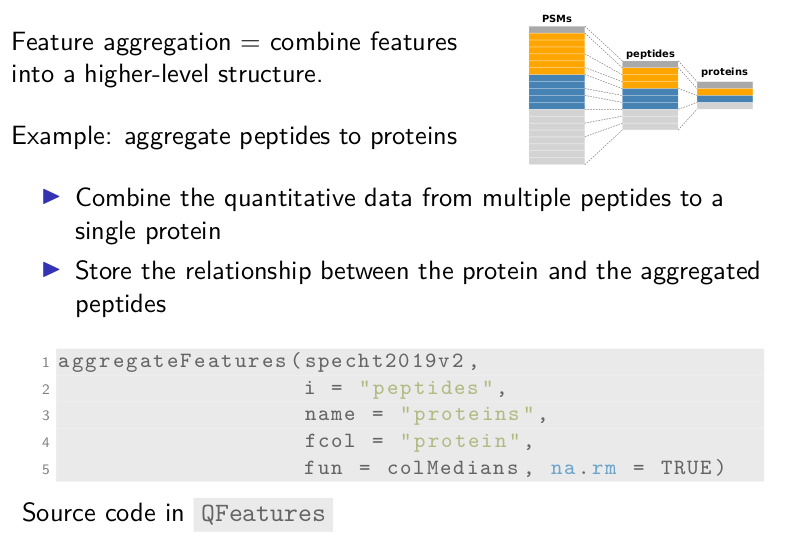
We use the aggregateFeatures for this. It takes the dataset, the
assay to aggregate, here the assay called peptides, the name of the
newly aggregated assay, here proteins, the metadata field name that
contains the protein to which the peptide belongs to, and a function
to combine the data with possible associated arguments.
Managing missingness
Single-cell technologies do contain many zeros, and so does
single-cell proteomics. Zeros can either be biological zeros or
technical zeros. They are better replaced by the missing value NA to
avoid confusion in downstream analyses. This is done by
zeroIsNA. Again, we supply the dataset and the name of the assay for
which the zeros should be replaced.
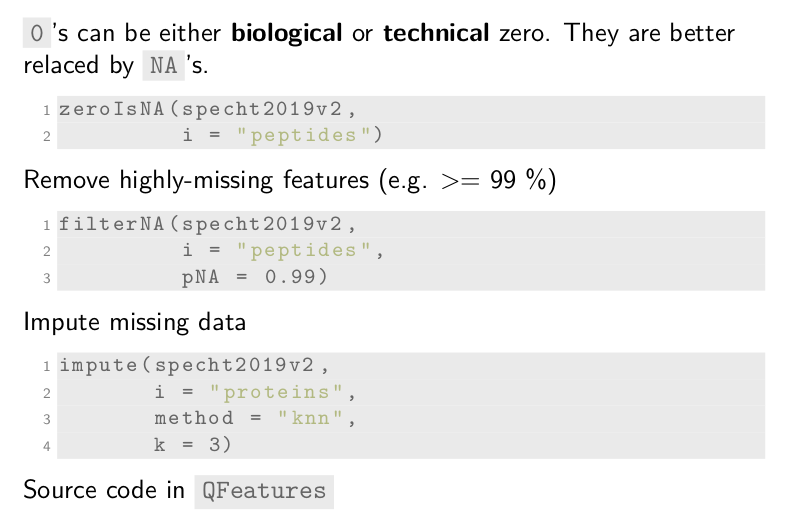
SCoPE2 and other single-cell pipelines remove highly-missing features,
for instance removing peptides that have over 99% missingness. This is
performed using the filterNA function. The pNA argument will
control the tolerated proportion of missingness.
Finally, missing data can be imputed using the impute function. This
code chunk imputes the assay called proteins using the KNN method
with k equals 3. Other methods are also available what facilitates
benchmarking of imputation methods.
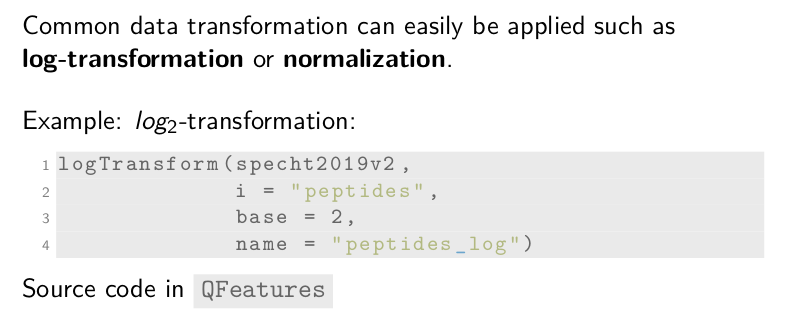
Data transformation
Another processing step is data transformation. We provide common data
transformation function, such as normalization and
log-transformation. For instance, we apply a base-2 log-transformation
using the logTransform function. Beside the dataset, we need to
supply the name of the assay to transform, the log base, and the name
of the new assay that will contain the transformed data.
Custom function
Finally, our framework can easily adapt to any custom function, for
example, batch correction using ComBat. It requires a three-step
procedure.
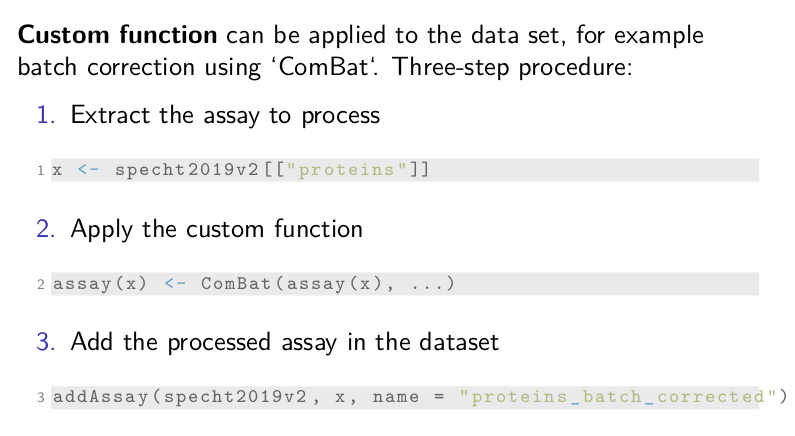
First, we extract the assay to process, here it is the
protein data. Then, we apply the custom function, ComBat in this
case. ComBat requires a data matrix that we can access with the
assay function. The dots represent the required arguments that we
omit here for clarity. Once, the assay data is overwritten, we can add
the transformed assay back in the dataset using addAssay. Remember
that the added assay should be a SingleCellExperiment.
Replication results
We replicated the SCoPE2 analysis using our standardized
framework. The results that are shown in the next slides compare the
expected SCoPE2 supplementary data with the output of our scp
framework.
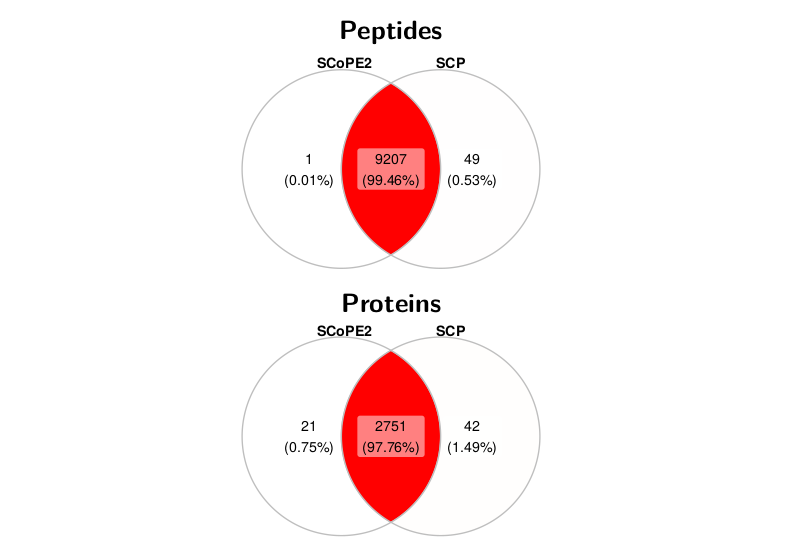
Selected Features
We first compared the selected features present in the two datasets. The overlap between the selected features is very high, for both the peptide and the protein data. Around 9000 peptides are common to both workflows, with over 99% agreement. Similarly, for proteins, around 2700 proteins are common to both workflows with over 97% agreement.
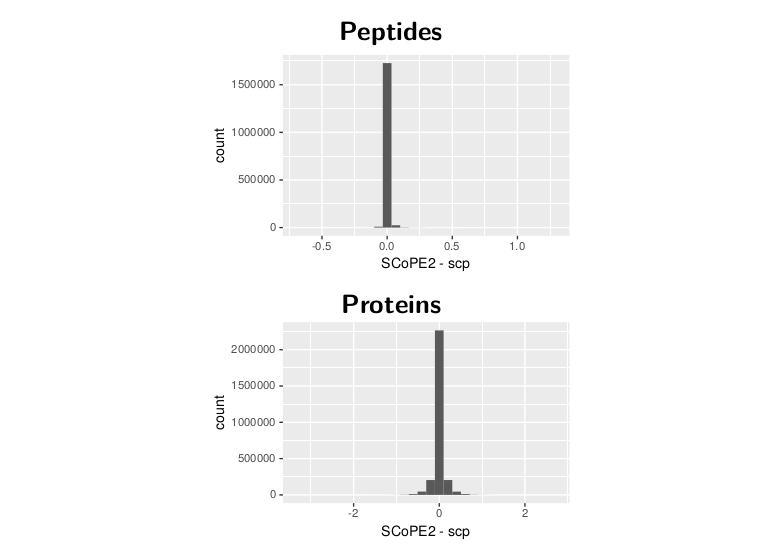
Numerical comparison
Next, we looked at the numerical differences. The graphs show the distribution of the difference between the two datasets. In order to do this, we had to subset the data matrices to common features and samples. The distribution sharply peaks around 0 for both protein and peptide data. The protein data is a bit more spread out because the differences seen for the peptide data accumulate during the processing.
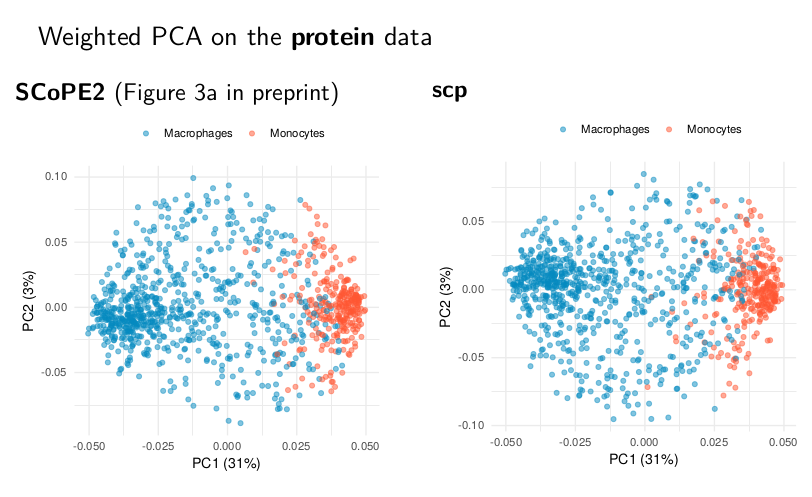
Replicate weighted PCA
Although small differences are seen, the datasets are highly similar. This can be seen from the weighted PCA plots on the protein data. The left figure can be found in the SCoPE2 preprint and the right figure is our attempt to reproduce it. The two PCA plots exhibit the exact same trend, indicating the underlying main patterns are well replicated.
Note about replication
Let’s finish the result part with a small note about reproducing data analyses. Identifying key processing steps is essential for reproducible work.
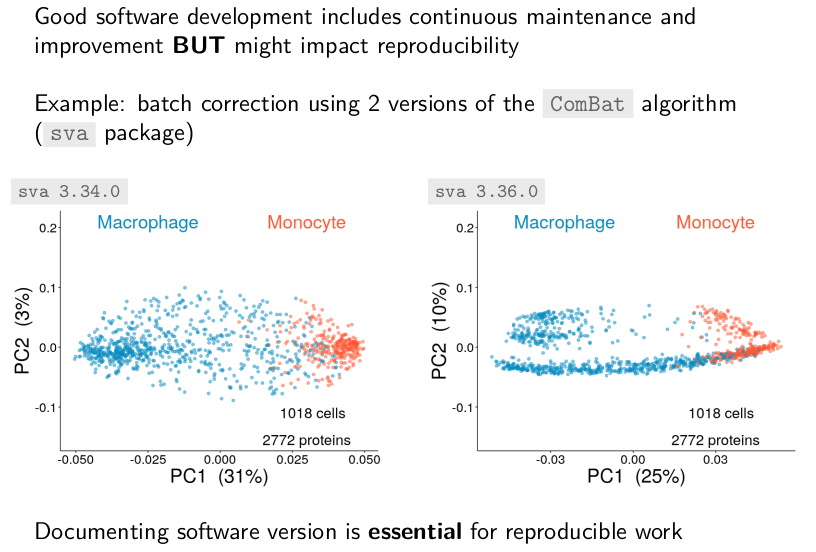
Good software development includes continuous maintenance and
improvement. Changes in the implementation of algorithms can impact
the reproducibility of an analysis. For example, we noticed, with the
help of Harrison Specht, that the batch correction results using
CombBat depended on the software versions. These differences are due
to a new invariant feature filter that was added recently to the batch
correction algorithm. This filtering step in turn highlighted
technical artefacts of the data.
Conclusions
Take home messages
Here are our main take home messages with regard to the scp package.
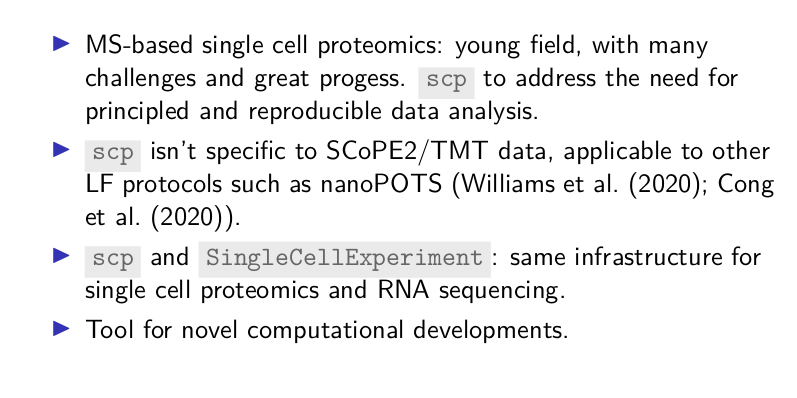
We are all excited by MS-based single cell proteomics and are well
aware of the many challenges ahead. With scp, we offer a principled
and reproducible way to manage, process and analyse such data. While
we have used SCoPE2 data as an illustration, the package isn’t limited
to MS2 labelled data. The processing functions in scp are perfectly
applicable to label free data which are generated using the nanoPOTS
method, which we also will highlight in future work. scp uses the
same data structure as scRNAseq data, which facilitates, when
relevant, consistent data processing and integration of various single
cell assay modalities. Most importantly, perhaps, this is only the
beginning, and we are already using scp for the next generation of
single cell proteomics data modelling.
Resources and acknowledgements:
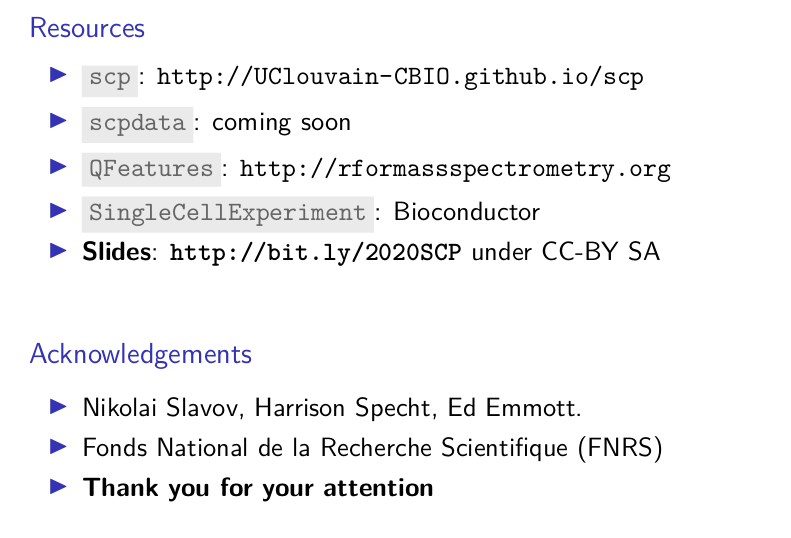
The scp package is publicly available at this
URL and has been submitted to
Bioconductor. We will also release the pre-formatted SCoPE2 data as
well as other single cell proteomics datasets that we use for our
method development. The QFeatures and SingleCellExperiment
packages have been available for quite some time now. Our slides are
also available at http://bit.ly/2020SCP.
We would like to thank Harrison, Ed and Nikolai for their keenness to share their data and experience with their data, the FNRS for funding this work and you for your attention.
References