Some brief advice on data analysis
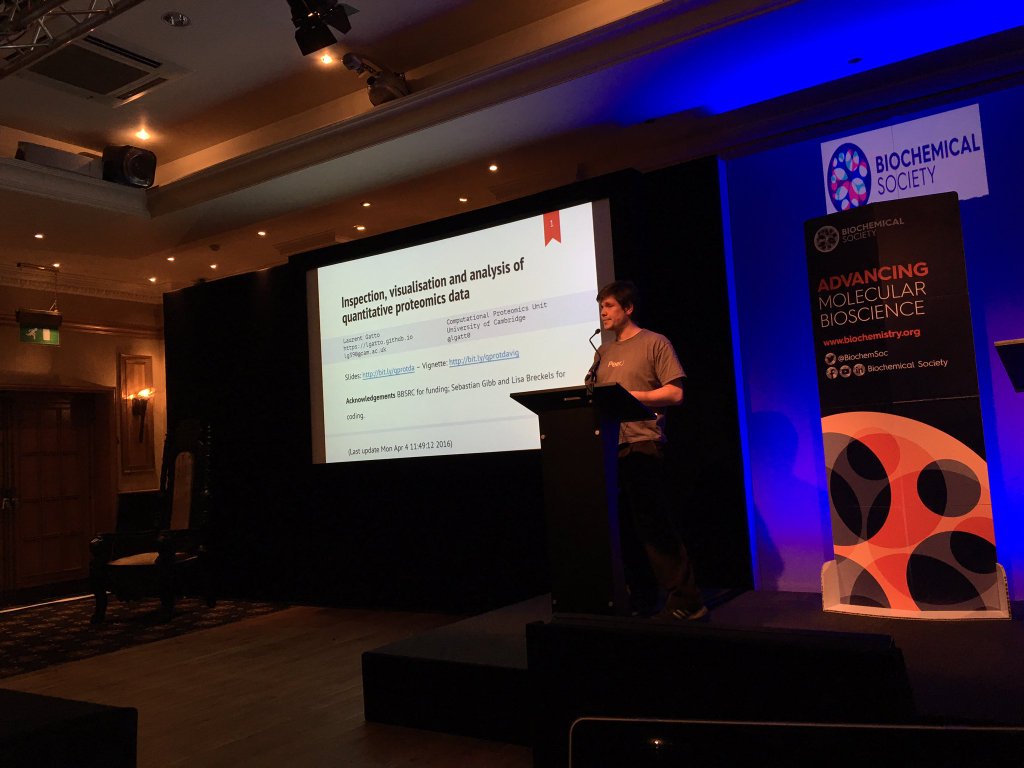
Following up from the Quantitative Proteomics and Data Analysis course, where in animated a discussion table about Inspection, visualisation and analysis of quantitative proteomics data (introductory slides and vignette), I wrote a few pieces of advice about data analysis. These are written for bio-sciences students and researchers who perform experiments and would like to analyse their data themselves, they are generally applicable to anyone who collects or plans to collect and want to analyse them.

Plan ahead
Learn about data analysis, the software or programming language you want to use/learn, how experts in your field analyse similar data, and try to practice and talk about data analysis before to actually do the work. Just as one can’t expect to start running with a marathon, don’t expect to analyse a non-trivial dataset from scratch without any prior practice.
Factor in analysis time
Data analysis takes time. Factor that in from the very beginning. I have seen too many situations were the paper/thesis had to be submitted really soon and people started to think about how to actually identify the most meaningful results from the data, or were still battling with conflicting advice from colleagues.
You won’t start your day at work with a good cup of coffee/tea, sit in front of your computer, cracked on with your data analysis and return home with all the results you expected. It will take time, multiple attempts and some amount of trial and error before you’ll consider it done.
Analyse early, analyse often
Ideally, data analysis will begin as soon as the first data is produced. Don’t wait for the full dataset to be ready. At that point, chances are that you will be expected to deliver results.
Data analysis will also inform on important properties or biases in the data, which you would want to know about as early as possible. At the end, it is often too late to consider re-running some experiments or adding replicates.
Divide and conquer
Data analysis should be deconstructed in a series of mini-analyses before and after which you visualise the data and effect of whatever operation (normalisation, filtering, …) you have applied to the data. You can’t expect the analyses to be performed in one single big step, i.e. feed it into a big box (whether it is closed or wide open for you to look inside) and get an acceptable result at the end. The data and questions to be solved are generally too complex for this to work.
When decomposing the analysis in multiple steps, you’ll realise that often there are multiple ways to solve a sub-question, and it is not always obvious which one is the best. To help yourself make appropriate decision for your data, visualise it, check the downstream effects of your decision, and don’t forget what your overall goal/question is. It is surprisingly easy to get sidetracked in tiny optimisations that only have a very minor influence on the final results and end up being overwhelmed by accidental (as opposed to essential/genuine) complexity (as described here for development of large-scale software system, but also applied to large data analysis). Make sure you understand what matters most (in terms of results and analyses decisions).
Sometimes, there won’t be any obvious better way; in that case, go for the easiest, most trackeable solution, or ask for advice/help from a experienced analyst, who most likely has already stumbled on that question.
Ask for help
Better late than never, but much better early on. It is very unlikely that your data and analysis is completely new and that there’s nobody that, either has already done that kind of analysis, or has the right experience to be helpful. Ask around, or on mailing lists and forums. But make sure you first do your homework, i.e. think about the problem and try to solve it.

