Class "Synapter"
Synapter.RdA reference class to store, manage and process Synapt G2 data to combine identification and quantitation results.
The data, intermediate and final results are stored together in such a ad-how container called a class. In the frame of the analysis of a set of 3 or 5 data files, namely as identification peptide, a quantitation peptide and a quantitation Pep3D, and identification fragments and quantitation spectra, such a container is created and populated, updated according to the user's instructions and used to display and export results.
The functionality of the synapter package implemented in the
Synapter class in described in the Details section
below. Documentation for the individual methods is provided in the
Methods section. Finally, a complete example of an analysis is
provided in the Examples section, at the end of this document.
See also papers by Shliaha et al. for details about ion mobility
separation and the manuscript describing the synapter
methodology.
Synapter(filenames, master) ## creates an instance of class 'Synapter'
Arguments
| filenames | A named |
|---|---|
| master | A |
Details
A Synapter object logs every operation that is applied to
it. When displayed with show or when the name of the instance
is typed at the R console, the original input file names, all
operations and resulting the size of the respective data are
displayed. This allows the user to trace the effect of respective
operations.
Loading the data
The construction of the data and analysis container, technically defined as an instance or object of classSynapter, is created
with the Synapter constructor.
This function requires 4 or 6 files as input, namely,
the identification final peptide csv file, the quantitation final peptide
csv file, the quantitation Pep3D csv file (as exported from the PLGS
software), the fasta file use for peptide identification, and optional
the identification fragments csv file and the quantitation
spectra xml file. The fasta file ('fasta') could be an RDS file generated by
link{createUniquePeptideDbRds}, too.
The file names need to be specified as a named list with names
'identpeptide', 'quantpeptide', 'quantpep3d', 'fasta', 'identfragments'
and 'quantspectra' respectively.
These files are read and the data is stored in the newly
created Synapter instance.
The final peptide files are filtered
to retain peptides with matchType corresponding to
PepFrag1 and PepFrag2, corresponding to unmodified
round 1 and 2 peptide identification. Other types, like
NeutralLoss_NH3, NeutralLoss_H20, InSource,
MissedCleavage or VarMod are not considered in the rest
of the analysis. The quantitation Pep3D data is filtered to retain
Function equal to 1 and unique quantitation spectrum ids,
i.e. unique entries for multiple charge states or isotopes of an EMRT
(exact mass-retention time features).
Then, p-values for Regular peptides are computed based on
the Regular and Random database types score
distributions, as described in Käll et al.,
2008a. Only unique peptide sequences are taken into account:
in case of duplicated peptides, only one entry is kept.
Empirical p-values are adjusted using Bonferroni
and Benjamini and Hochberg, 1995 (multtest package)
and q-values are computed using the qvalue package
(Storey JD and Tibshirani R., 2003 and Käll et
al., 2008b). Only Regular entries are stored in the
resulting data for subsequent analysis.
The data tables can be exported as csv spreadsheets with the
writeIdentPeptides and writeQuantPeptides methods.
Filtering identification and quantitation peptide
The first step of the analysis aims to match reliable peptide. The final peptide datasets are filtered based on the FDR (BH is default) using thefilterQuantPepScore and filterIdentPepScore
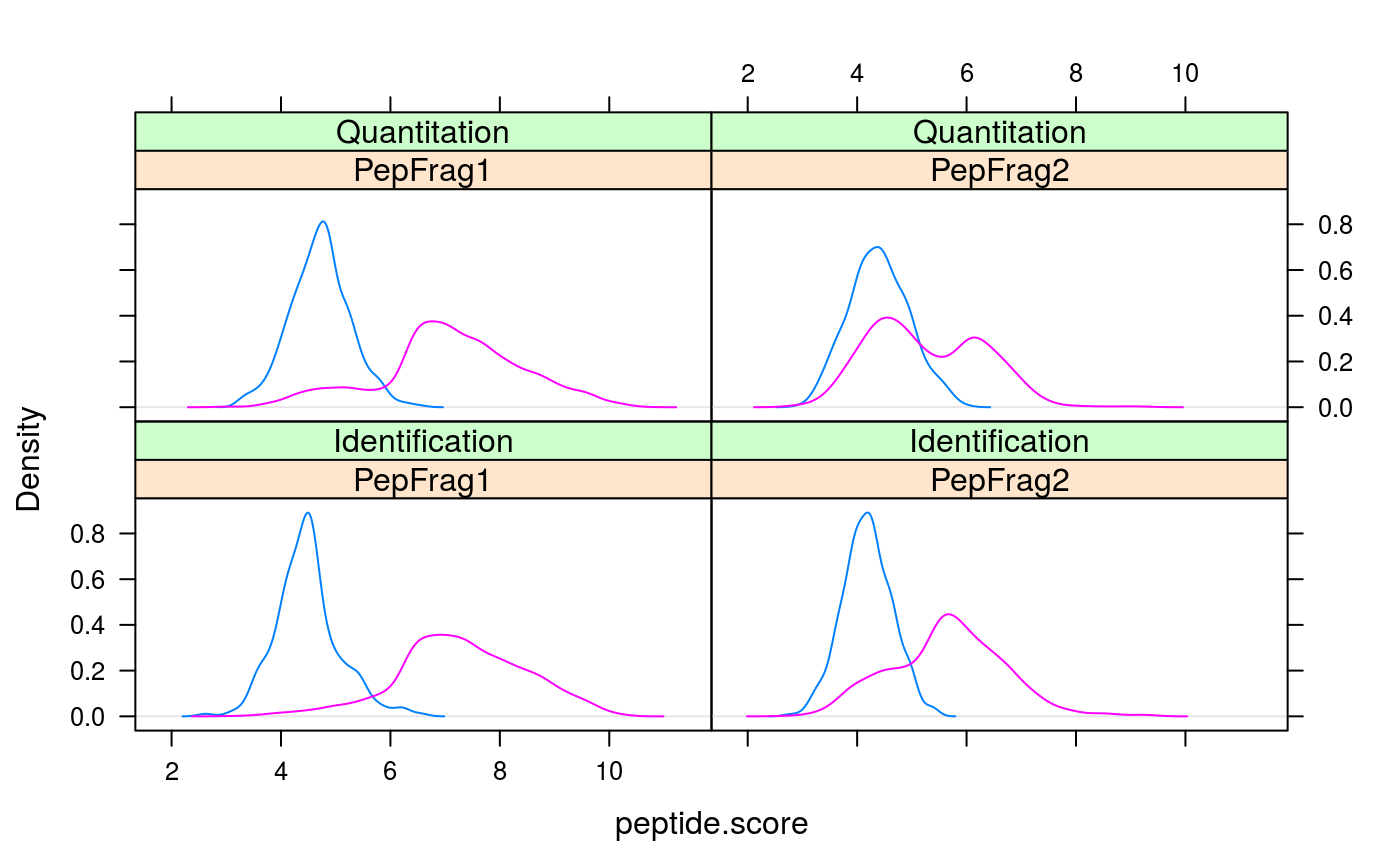
methods. Several plots are provided to illustrate peptide score
densities (from which p-values are estimated, plotPepScores;
use getPepNumbers to see how many peptides were available) and
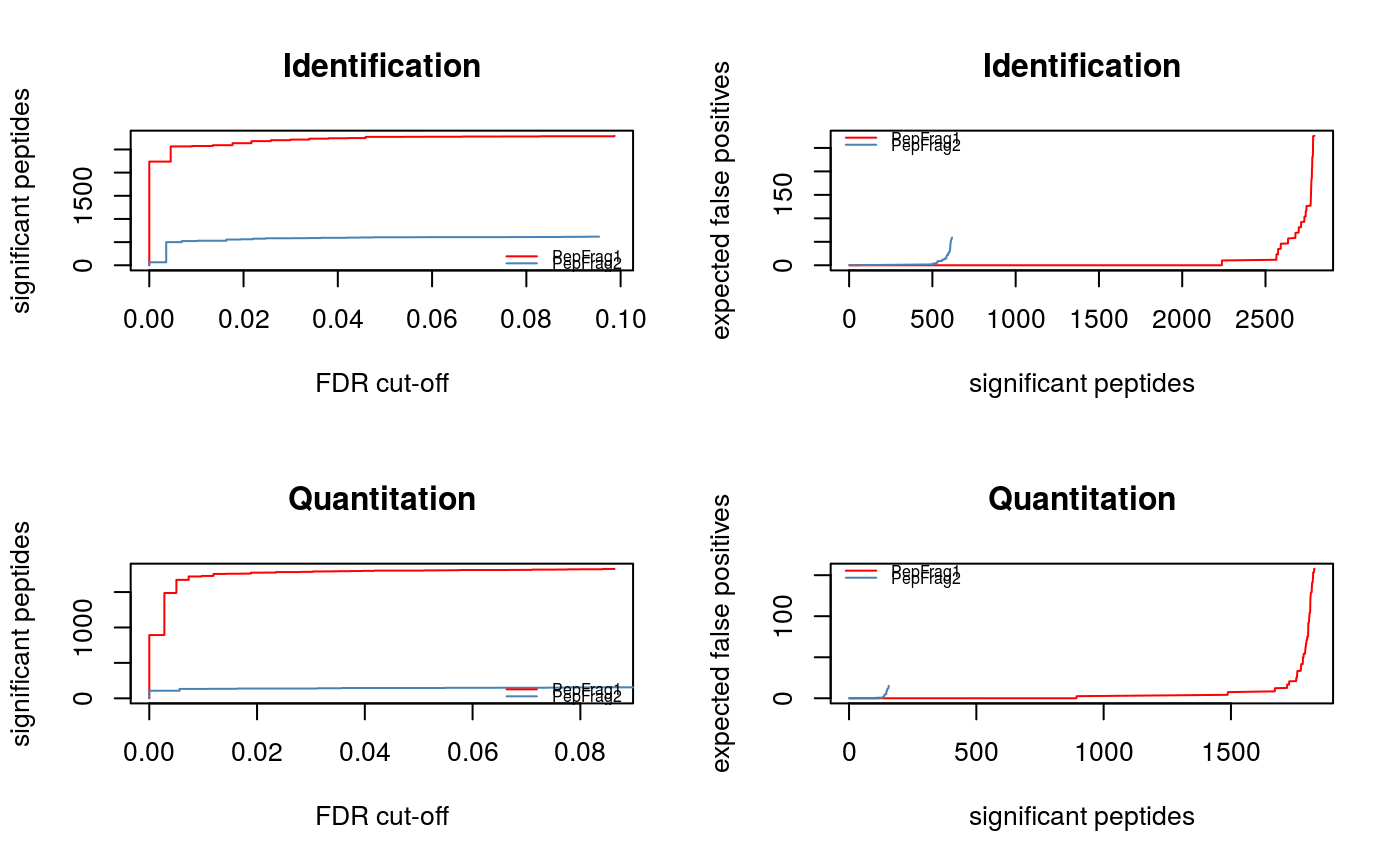
q-values (plotFdr).
Peptides matching to multiple proteins in the fasta file (non-unique
tryptic identification and quantitation peptides) can be
discarded with the filterUniqueDbPeptides method. One can
also filter on the peptide length using filterPeptideLength.
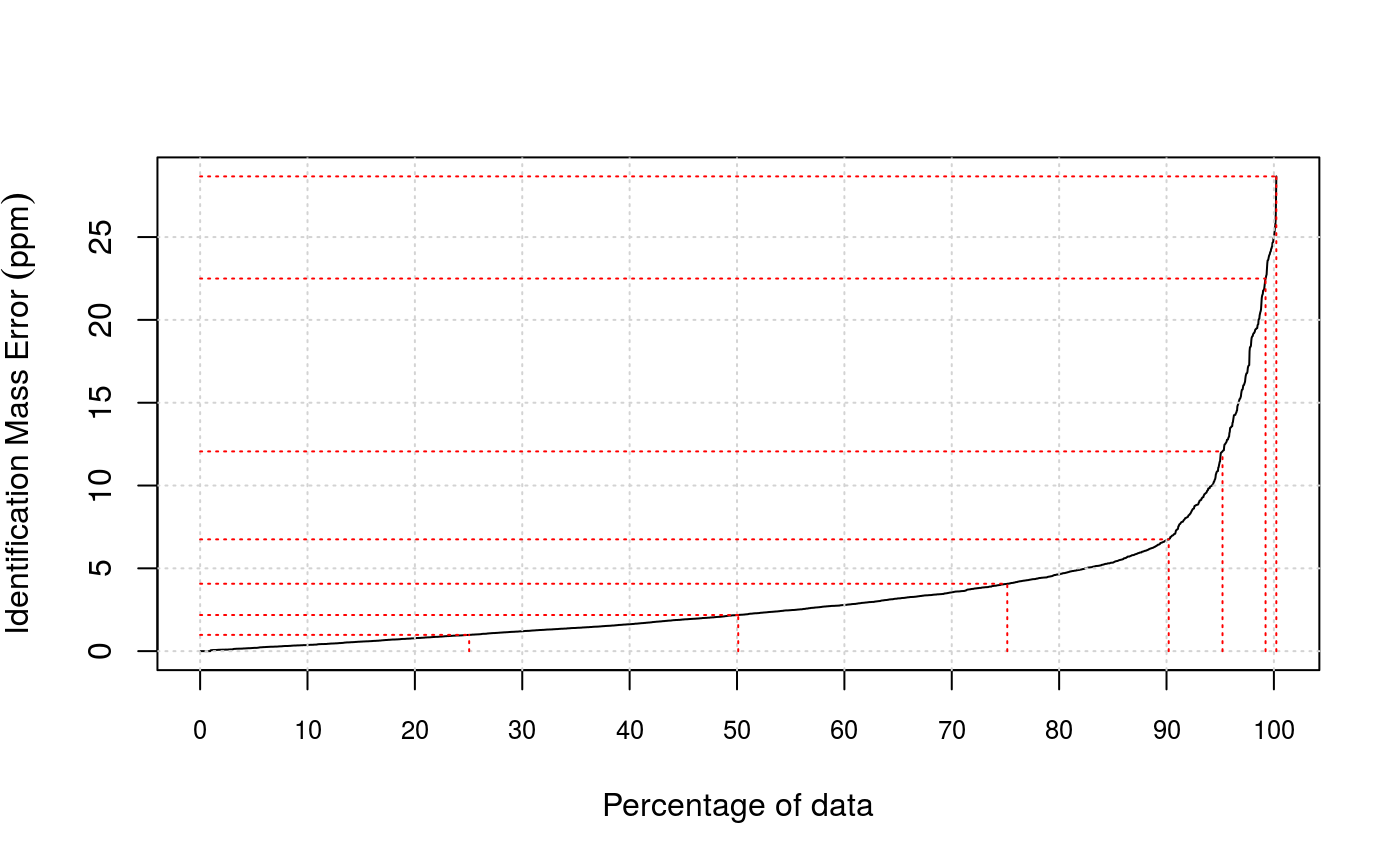
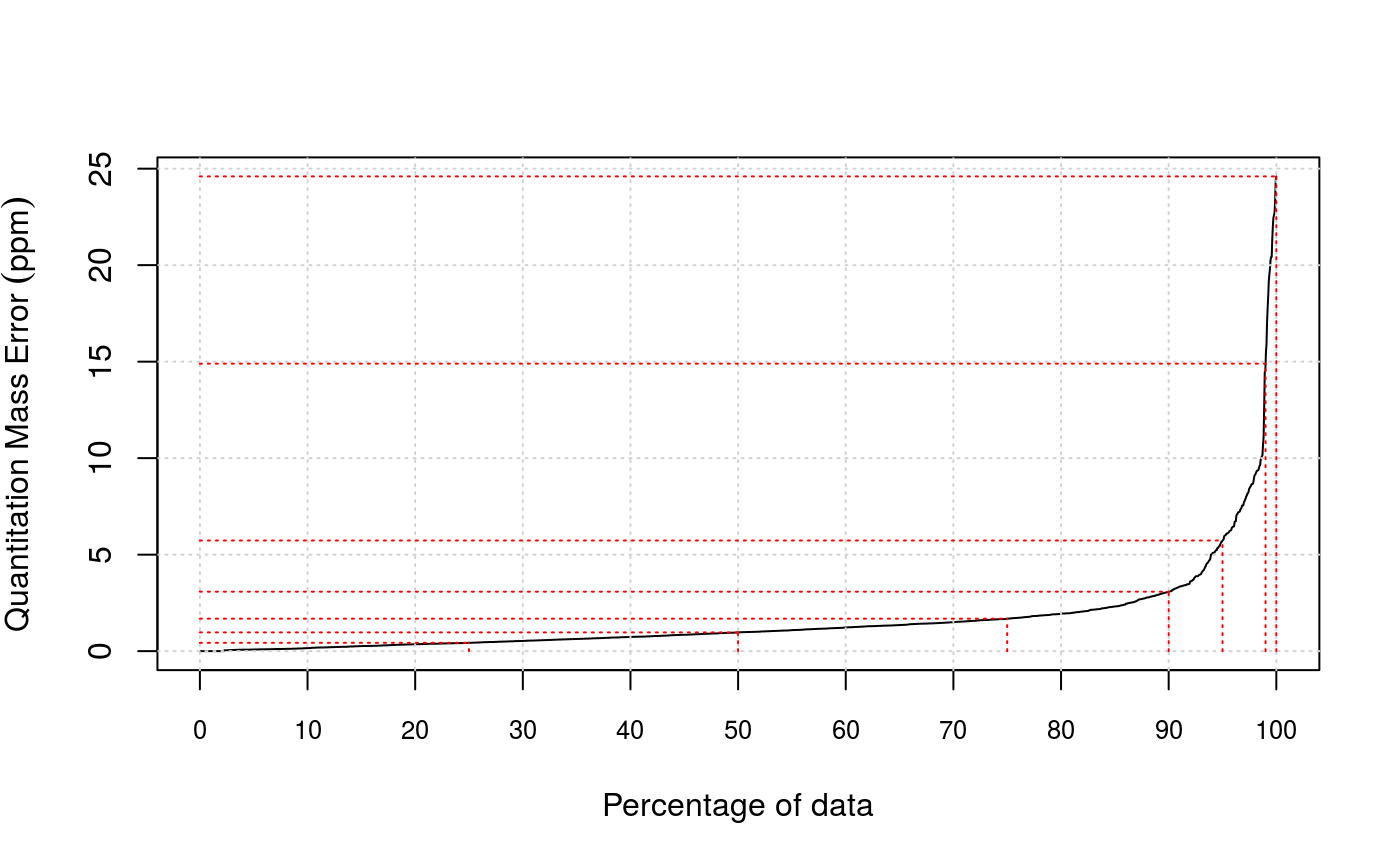
Another filtering criterion is mass accuracy. Error tolerance
quantiles (in ppm, parts per million) can be visualised with the
plotPpmError method. The values can be retrieved with
getPpmErrorQs. Filtering is then done separately for
identification and quantitation peptide data using
filterIdentPpmError and filterQuantPpmError
respectively. The previous plotting functions can be used again to
visualise the resulting distribution.
Filtering can also be performed at the level of protein false
positive rate, as computed by the PLGS application
(protein.falsePositiveRate column), which counts the
percentage of decoy proteins that have been identified prior to the
regular protein of interest. This can be done with the
filterIdentProtFpr and filterQuantProtFpr methods.
Note that this field is erroneously called a false positive rate in
the PLGS software and the associated manuscript; it is a false
discovery rate.
Merging identification and quantitation peptides
Common and reliable identification and quantitation peptides are then matched based on their sequences and merged using themergePeptides method.
Retention time modelling
Systematic differences between identification features and quantitation features retention times are modelled by fitting a local regression (see theloess function for
details), using the modelRt method. The smoothing parameter,
or number of neighbour data points used the for local fit, is
controlled by the span parameter that can be set in the above
method.
The effect of this parameter can be observed with the plotRt
method, specifying what = "data" as parameters. The resulting
model can then be visualised with the above method specifying
what = "model", specifying up to 3 number of standard
deviations to plot. A histogram of retention time differences can
be produced with the plotRtDiffs method.
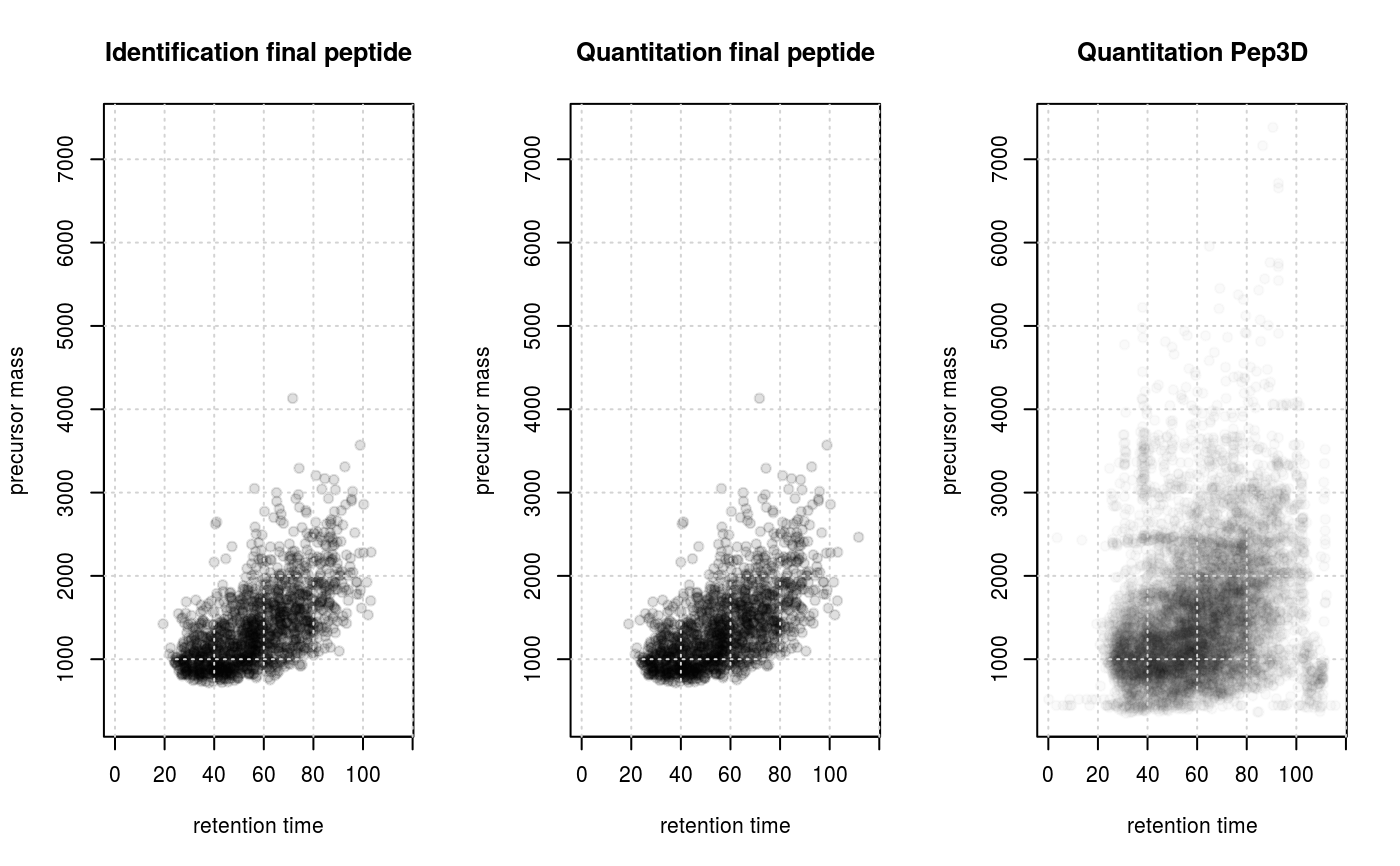
To visualise the feature space plotFeatures could be used. It
generates one or two (if ion mobility is available) plots of
retention time vs mass and mass vs ion mobility for each data source,
namely, Identification data, Quantitation data and Quantitation Pep3D data.
Intensity modelling
Systematic differences between intensities of identification features and quantitation features depending on retention times are modelled by fitting a local regression (see theloess function for
details), using the modelIntensity method. The smoothing parameter,
or number of neighbour data points used the for local fit, is
controlled by the span parameter that can be set in the above
method.
The effect of this parameter can be observed with the plotIntensity
method, specifying what = "data" as parameters. The resulting
model can then be visualised with the above method specifying
what = "model", specifying up to 3 number of standard
deviations to plot.
Grid search to optimise matching tolerances
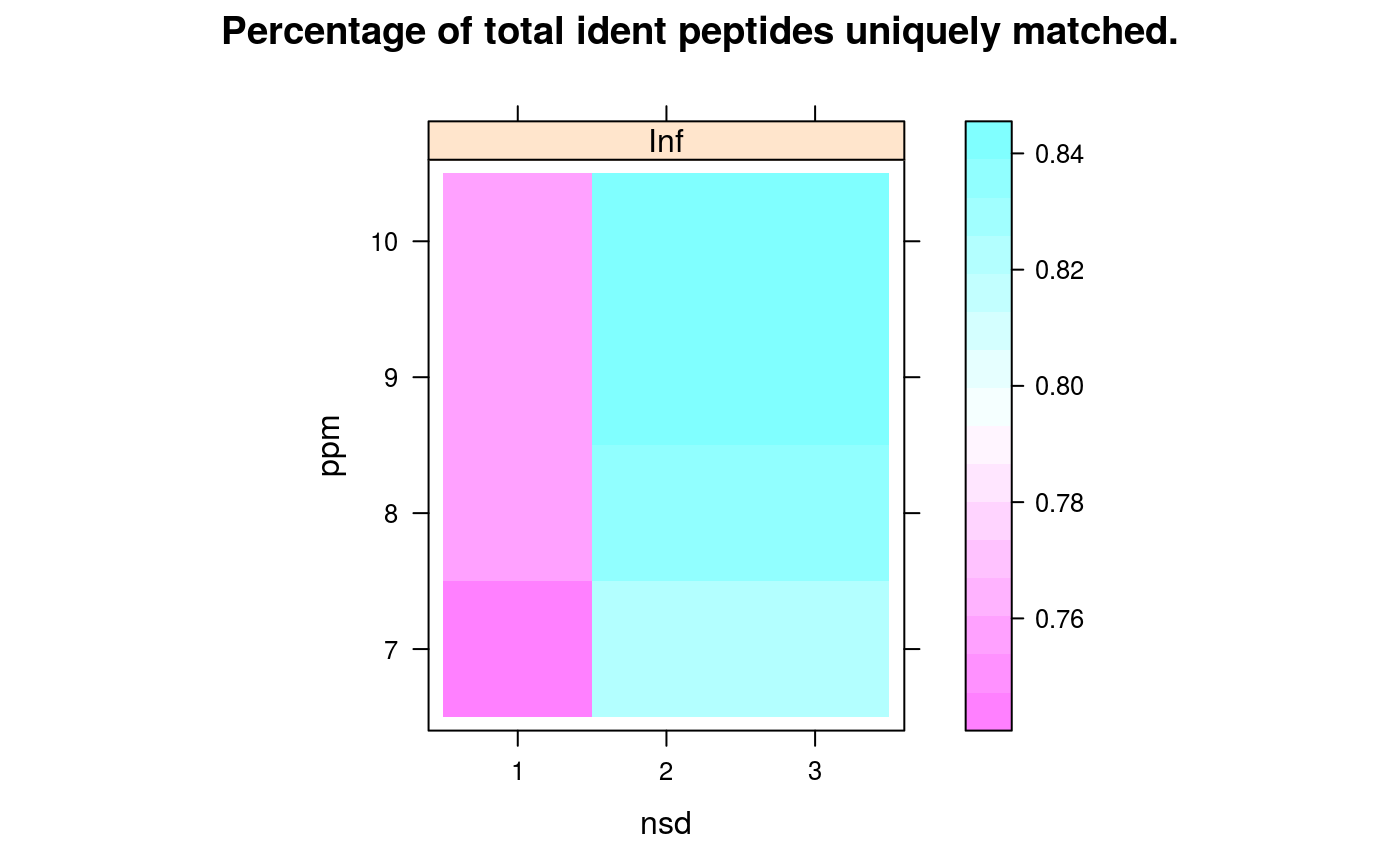
Matching of identification peptides and quantitation EMRTs is done within a mass tolerance in parts per million (ppm) and the modelled retention time +/- a certain number of standard deviations. To help in the choice of these two parameters, a grid search over a set of possible values is performed and performance metrics are recorded, to guide in the selection of a 'best' pair of parameters. The following metrics are computed: (1) the percentage of identification peptides that matched a single quantitation EMRT (calledprcntTotal),
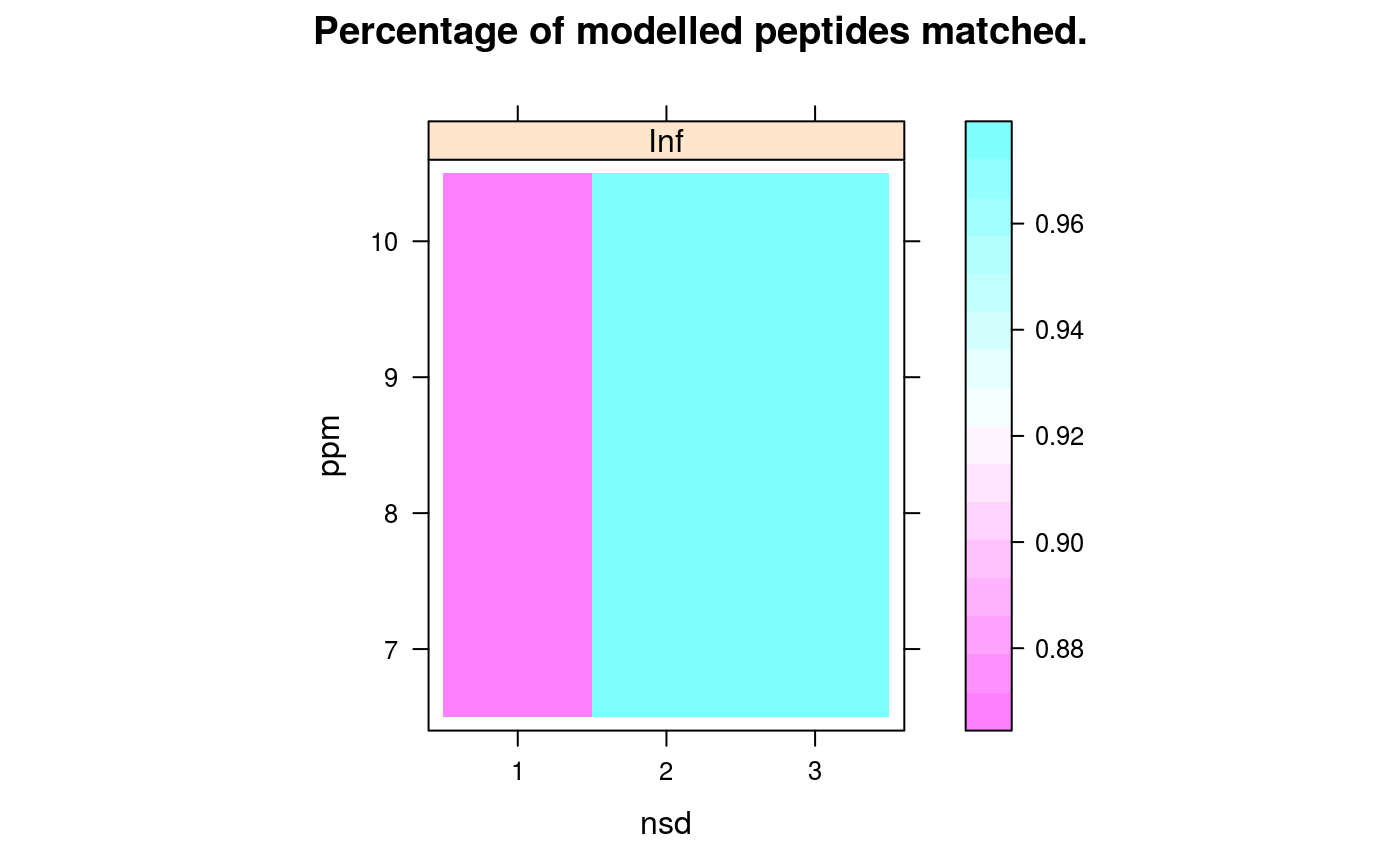
(2) the percentage of identification peptides used in the retention time
model that matched the quantitation EMRT corresponding to the
correct quantitation peptide in ident/quant pair of the model
(called prcntModel)
and
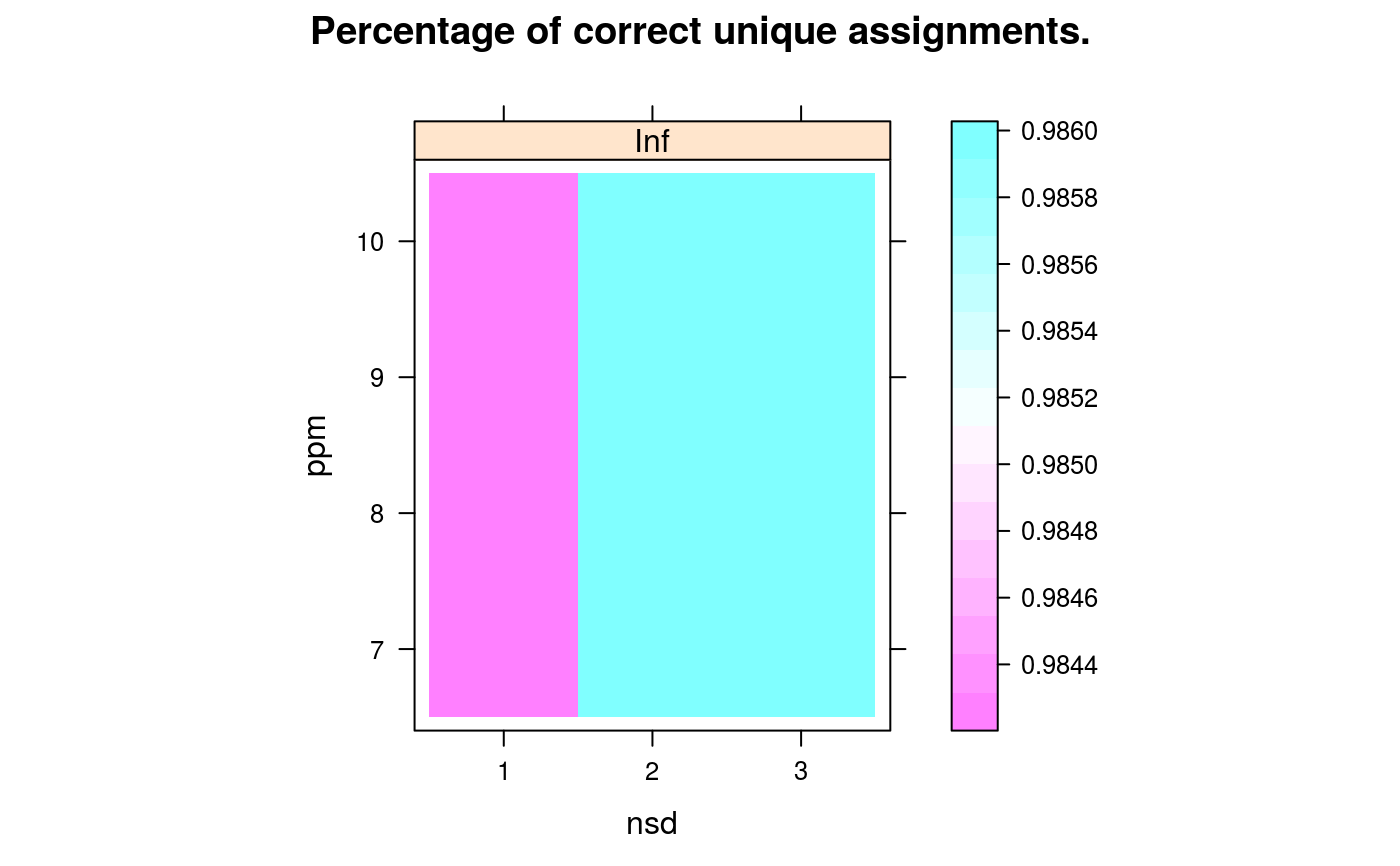
(3) the detailed about the matching of the features used for
modelling (accessible with getGridDetails) and the
corresponding details grid that reports the percentage of
correct unique assignments.
The detailed grid results specify the number of non
matched identification peptides (0), the number of correctly (1) or
wrongly (-1) uniquely matched identification peptides, the number of
identification peptides that matched 2 or more peptides including
(2+) or excluding (2-) the correct quantitation equivalent are also
available.
See the next section for additional details about how matching.
The search is performed with the searchGrid method, possibly
on a subset of the data (see Methods and Examples sections for
further details).
The parameters used for matching can be set manually with
setPpmError, setRtNsd, setImDiff respectively,
or using setBestGridParams to apply best parameters as defined using
the grid search. See example and method documentation for details.
Identification transfer: matching identification peptides and quantitation EMRTs
The identification peptide - quantitation EMRT matching, termed identification transfer, is performed using the best parameters, as defined above with a grid search, or using user-defined parameters. Matching is considered successful when one and only one EMRT is found in the mass tolerance/retention time/ion mobility window defined by the error ppm, number of retention time standard deviations, and ion mobility difference parameters. The values of uniquely matched EMRTs are reported in the final matched dataframe that can be exported (see below). If however, none or more than one EMRTs are matched, 0 or the number of matches are reported. As identification peptides are serially individually matched to 'close' EMRTs, it is possible for peptides to be matched the same EMRT independently. Such cases are reported as -1 in the results dataframes. The results can be assess using theplotEMRTtable (or
getEMRTtable to retrieve the values) and performace
methods. The former shows the number of identification peptides assigned to
none (0), exactly 1 (1) or more (> 2) EMRTs.
The latter method reports matched identification peptides, the number of
(q-value and protein FPR filtered) identification and quantitation peptides.
Matched EMRT and quantitation peptide numbers are then compared
calculating the synapter enrichment (100 * ( synapter - quant ) / quant)
and Venn counts.
Remove Less Intense Peaks
As an additional step it is possible to remove less intense peaks from the spectra and fragment data. UseplotCumulativeNumberOfFragments to
plot the number of fragments vs the intensity and to find a good threshold.
The filterFragments method could remove peaks if the intensity is
below a specified threshold via the minIntensity argument. Set the
maxNumber argument to keep only the maxNumber highest
peaks/fragments. The what argument controls the data on which the
filter is applied. Use what = "fragments.ident" for the
identification fragments and what = "spectra.quant" for the
quantiation spectra data.
Fragment Matching
After importing fragment and spectra data it is possible to match peaks between the identification fragments and the quantitation spectra using thefragmentMatching method.
Use setFragmentMatchingPpmTolerance to set
the maximal allowed tolerance for considering a peak as identical.
There are two different methods to visualise the results of the fragment
matching procedure. plotFragmentMatching plots the fragments and
spectra for each considered pair.
plotFragmentMatchingPerformance draws two plots. On the left panel
you could see the performance of different thresholds for the number of
common peaks for unique matches. The right panel visualizes the performance
of different differences (delta) of common peaks between the best match
(highest number of common peaks) and the second best match in each non
unique match group. plotFragmentMatchingPerformance returns the
corresponding values invisible or use fragmentMatchingPerformance to
access these data.
Use filterUniqueMatches and filterNonUniqueMatches to remove
unique or non unique matches below the threshold of common peaks
respective the difference in common peaks from the MatchedEMRTs data.frame.
Exporting and saving data
The merged identification and quantitation peptides can be exported to csv using thewriteMergedPeptides method. Similarly, the
matched identification peptides and quantitation EMRTs are exported
with writeMatchedEMRTs.
Complete Synapter instances can be serialised with
save, as any R object, and reloaded with load for
further analysis.
It is possible to get the fragment and spectra data from the identification
and quantitation run using getIdentificationFragments respectively
getQuantitationSpectra.
Methods
Analysis methods
- mergePeptides
signature(object = "Synapter"): Merges quantitation and identification final peptide data, used to perform retention time modelling (seemodelRtbelow).- modelRt
signature(object = "Synapter",
	  span = "numeric")
: Performs local polynomial regression fitting (seeloess) retention time alignment usingspanparameter value to control the degree of smoothing.- modelIntensity
signature(object = "Synapter",
	  span = "numeric")
: Performs local polynomial regression fitting (seeloess) intensity values usingspanparameter value to control the degree of smoothing.- findEMRTs
signature(object = "Synapter", ppm =
	  "numeric", nsd = "numeric", imdiff = "numeric")
: Finds EMRTs matching identification peptides usingppmmass tolerance,nsdnumber of retention time standard deviations andimdiffdifference in ion mobility. The last three parameters are optional if previously set withsetPpmError,setRtNsd,setImDiff, or, better,setBestGridParams(see below).- rescueEMRTs
signature(object = "Synapter",
    method = c("rescue", "copy"))
: Themethodparameter defined the behaviour for those high confidence features that where identified in both identification and quantitation acquisitions and used for the retention time model (seemergePeptides). Prior to version 1.1.1, these features were transferred from the quantitation pep3d file if unique matches were found, as any feature ("transfer"). As a result, those matching 0 or > 1 EMRTs were quantified asNA. The default is now to"rescue"the quantitation values of these by directly retrieving the data from the quantification peptide data. Alternatively, the quantitation values for these features can be directly taken from the quantitation peptide data using"copy", thus effectively bypassing identification transfer.- searchGrid
signature(object="Synapter",
	  ppms="numeric", nsds="numeric", imdiffs = "numeric",
    subset="numeric", n = "numeric", verbose="logical")
: Performs a grid search. The grid is defined by theppm,nsdandimdiffsnumerical vectors, representing the sequence of values to be tested. Default areseq(5, 20, 2),seq(0.5, 5, 0.5),seq(0.2, 2, 0.2)respectively. To ignore ion mobility setimdiffs = Inf.subsetandnallow to use a randomly chosen subset of the data for the grid search to reduce search time.subsetis a numeric, between 0 and 1, describing the percentage of data to be used;nspecifies the absolute number of feature to use. The default is to use all data.verbosecontrols whether textual output should be printed to the console. (Note, themergedEMRTsvalue used in internal calls tofindEMRTsis"transfer"- seefindEMRTsfor details).- fragmentMatching
signature(object="Synapter",
      ppm = "numeric", verbose = "logical"
: Performs a fragment matching between spectra and fragment data. Theppmargument controls the tolerance that is used to consider two peaks (MZ values) as identical. IfverboseisTRUE(default) a progress bar is shown.
Methods to display, access and set data
- show
signature(object = "Synapter"): Displayobjectby printing a summary to the console.- dim
signature(x="Synapter"): Returns alistof dimensions for the identification peptide, quantitation peptide, merged peptides and matched features data sets.- inputFiles
signature(object="Synapter"): Returns acharacterof length 6 with the names of the input files used asidentpeptide,quantpeptide,quantpep3d,fasta,identfragmentsandquantspectra.- getLog
signature(object="Synapter"): Returns acharacterof variable length with a summary of processing undergone byobject.- getGrid
signature(object="Synapter", digits =
	  "numeric")
: Returns a namedlistof length 3 with the precent of total (prcntTotal), percent of model (prcntModel) and detailed (details) grid search results. Thedetailsgrid search reports the proportion of correctly assigned features (+1) to all unique assignments (+1 and -1). Values are rounded to 3digitsby default.- getGridDetails
signature(object="Synapter"): Returns alistof number of ..., -2, -1, 0, +1, +2, ... results found for each of theppm/nsdpairs tested during the grid search.- getBestGridValue
signature(object="Synapter"): Returns a namednumericof length 3 with best grid values for the 3 searches. Names areprcntTotal,prcntModelanddetails.- getBestGridParams
signature(object="Synapter"): Returns a namedlistof matrices (prcntTotal,prcntModelanddetails). Each matrix gives theppmandnsdpairs that yielded the best grid values (seegetBestGridValueabove).- setBestGridParams
signature(object="Synapter",
	  what="character")
: This methods set the best parameter pair, as determined bywhat. Possible values areauto(default),model,totalanddetails. The 3 last ones use the (first) best parameter values as reported bygetBestGridParams.autouses the bestmodelparameters and, if several best pairs exists, the one that maximisesdetailsis selected.- setPepScoreFdr
signature(object="Synapter", fdr =
	  "numeric")
: Sets the peptide score false discovery rate (default is 0.01) threshold used byfilterQuantPepScoreandfilterIdentPepScore.- getPepScoreFdr
signature(object="Synapter"): Returns the peptide false discrovery rate threshold.- setIdentPpmError
signature(object="Synapter", ppm =
	  "numeric")
: Set the identification mass tolerance toppm(default 10).- getIdentPpmError
signature(object="Synapter"): Returns the identification mass tolerance.- setQuantPpmError
signature(object="Synapter", ppm =
	  "numeric")
: Set the quantitation mass tolerance toppm(default 10).- getQuantPpmError
signature(object="Synapter"): Returns the quantitation mass tolerance.- setPpmError
signature(object="Synapter", ppm =
	  "numeric")
: Sets the identification and quantitation mass toleranceppm(default is 10).- setLowessSpan
signature(object="Synapter", span =
	  "numeric")
: Sets theloessspanparameter; default is 0.05.- getLowessSpan
signature(object="Synapter"): Returns thespanparameter value.- setRtNsd
signature(object="Synapter", nsd =
	  "numeric")
: Sets the retention time tolerancensd, default is 2.- getRtNsd
signature(object="Synapter"): Returns the value of the retention time tolerancensd.- setImDiff
signature(object="Synapter", imdiff =
	  "numeric")
: Sets the ion mobility toleranceimdiff, default is 0.5.- getImDiff
signature(object="Synapter"): Returns the value of the ion mobility toleranceimdiff.- getPpmErrorQs
signature(object="Synapter", qs =
	  "numeric", digits = "numeric")
: Returns the mass toleranceqsquantiles (default isc(0.25, 0.5, 0.75, seq(0.9, 1, 0.01)) for the identification and quantitation peptides. Default is 3digits.- getRtQs
signature(object="Synapter", qs =
	  "numeric", digits = "numeric")
: Returns the retention time toleranceqsquantiles (default isc(0.25, 0.5, 0.75, seq(0.9, 1, 0.01)) for the identification and quantitation peptides. Default is 3digits.- getPepNumbers
signature(object="Synapter"): Returns the number of regular and random quantitation and identification peptide considered for p-value calculation and used to plot the score densities (seeplotPepScores). Especially the difference between random and regular entries are informative in respect with the confidence of the random scores distribution.- setFragmentMatchingPpmTolerance
signature(object="Synapter",
        ppm = "numeric")
: Sets the fragment matching mass toleranceppm(default is 25).- getFragmentMatchingPpmTolerance
signature(object="Synapter"): Returns the fragment matching mass tolerance in ppm.- showFdrStats
signature(object="Synapter", k =
	  "numeric")
: Returns a namedlistof length 2 with the proportion of identification and quantitation peptides that are considered significant with a threshold ofk(default isc(0.001, 0.01, 0.5, 0.1)) using raw and adjusted p-values/q-values.- getEMRTtable
signature(object="Synapter"): Returns atablewith the number of 0, 1, 2, ... assigned EMRTs.- performance
signatute(object="Synapter", verbose =
	  TRUE)
: Returns (and displays, ifverbose) the performance of the synapter analysis.- performance2
signatute(object="Synapter", verbose =
	  TRUE)
: Returns (and displays, ifverbose) information about number of missing values and identification source of transfered EMRTs.- fragmentMatchingPerformance
signature(object="Synapter",
          what = c("unique", "non-unique")
: Returns the performance of the fragment matching forunqiueornon-uniquematches. The return valus is amatrixwith seven columns. The first columnncommon/deltacommoncontains the thresholds. Column 2 to 5 are the true positivestp, false positivesfp, true negativestn, false negativesfnfor the merged peptide data. The sixth columnallshows the corresponding number of peptides for all peptides (not just the merged ones) and the last column shows the FDRfdrfor the current threshold (in that row) for the merged data. Please note that the FDR is overfitted/underestimated because the merged peptides are the peptides from the highest quality spectra were PLGS could easily identify the peptides. The peptides that are not present in the merged data are often of lower quality hence the FDR would be higher by trend. SeeplotFragmentMatchingPerformancefor a graphical representation.
Filters
- filterUniqueDbPeptides
signature(object="Synapter",
          missedCleavages = 0, IisL = TRUE, verbose = TRUE)
: This method first digests the fasta database file and keeps unique tryptic peptides. (NOTE: since version 1.5.3, the tryptic digestion uses thecleaverpackage, replacing the more simplistic inbuild function. The effect of this change is documented in https://github.com/lgatto/synapter/pull/47). The number of maximal missed cleavages can be set asmissedCleavages(default is 0). IfIisL = TRUEIsoleucin and Leucin are treated as the same aminoacid. In this case sequences like "ABCI", "ABCL" are removed because they are not unqiue anymore. IfIisL = FALSE(default) "ABCI" and "ABCL" are reported as unique. The peptide sequences are then used as a filter against the identification and quantitation peptides, where only unique proteotyptic instances (no miscleavage allowed by default) are eventually kept in theobjectinstance. This method also removes any additional duplicated peptides, that would not match any peptides identified in the fasta database.- filterUniqueQuantDbPeptides
signature(object="Synapter",
    missedCleavages = 0, IisL = TRUE, verbose = TRUE)
: AsfilterUniqueDbPeptidesfor quantitation peptides only.- filterUniqueIdentDbPeptides
signature(object="Synapter",
    missedCleavages = 0, IisL = TRUE, verbose = TRUE)
: AsfilterUniqueDbPeptidesfor identification peptides only.- filterQuantPepScore
signature(object="Synapter", fdr
	  = "numeric", method = "character")
: Filters the quantitation peptides usingfdrfalse discovery rate.fdris missing by default and is retrieved withgetPepScoreFdrautomatically. If not set, default value of 0.01 is used.methoddefines how to performe p-value adjustment; one ofBH,Bonferroneorqval. See details section for more information.- filterIdentPepScore
signature(object="Synapter", fdr
	  = "numeric", method = "charactet")
: AsfilterQuantPepScore, but for identification peptides.- filterQuantProtFpr
signature(object="Synapter", fpr
	  = "numeric")
: Filters quantitation peptides using the protein false positive rate (erroneously defined as a FPR, should be FDR), as reported by PLGS, using threshold set byfpr(missing by default) or retrieved bygetProtFpr.- filterIdentProtFpr
signature(object="Synapter", fpr =
	  "numeric")
: asfilterQuantProtFpr, but for identification peptides.- filterQuantPpmError
signature(object="Synapter", ppm
	  = "numeric")
: Filters the quantitation peptides based on the mass toleranceppm(default missing) provided or retrieved automatically usinggetPpmError.- filterIdentPpmError
signature(object="Synapter"): asfilterQuantPpmError, but for identification peptides.- filterFragments
signature(object = "Synapter",
        what = c("fragments.ident", "spectra.quant"),
        minIntensity = "numeric", maxNumber = "numeric", verbose = "logical")
: Filters the spectra/fragment data using a minimal intensity threshold (minIntensity) or a maximal number of peaks/fragments threshold (maxNumber). Please note that the maximal number is transfered to an intensity threshold and the result could contain less peaks than specified bymaxNumber. If both arguments are given, the more aggressive one is chosen. Use thewhatargument to specify the data that should be filtered. Setwhat = "fragments.ident"for the identification fragment data orwhat = "spectra.quant"for the quantiation spectra. IfverboseisTRUE(default) a progress bar is shown.- filterUniqueMatches
signature(object="Synapter", minNumber =
        "numeric")
: Removes all unique matches that have less thanminNumberof peaks/fragments in common. UsefragmentMatchingPerformance(..., what="unique")/plotFragmentMatchingPerformance(left panel) to find an ideal threshold.- filterNonUniqueMatches
signature(object="Synapter", minDelta =
        "numeric")
: Removes all non unique matches that have a difference between the best match (highest number of common peaks/fragments, treated as true match) and the second best match (second highest number of common peaks/fragments) less thanminDelta. For the matches above the threshold only the one with the highest number of common peaks/fragments in each match group is kept. UsefragmentMatchingPerformance(..., what="non-unique")/plotFragmentMatchingPerformance(right panel) to find an ideal threshold.- filterNonUniqueIdentMatches
signature(object="Synapter"): Removes all non unique identification matches. In rare circumstances (if the grid search parameters are to wide/relaxed or a fragment library is used) it could happen that thesearchGridmethods matches a single quantification EMRT to multiple identification EMRTs. This methods removes all these non unique matches.
Plotting
- plotPpmError
signature(object="Synapter", what =
	  "character")
: Plots the proportion of data against the mass error tolerance in ppms. Depending onwhat, the data for identification (what = "Ident"), quantitation (what = "Quant") or"both"is plotted.- plotRtDiffs
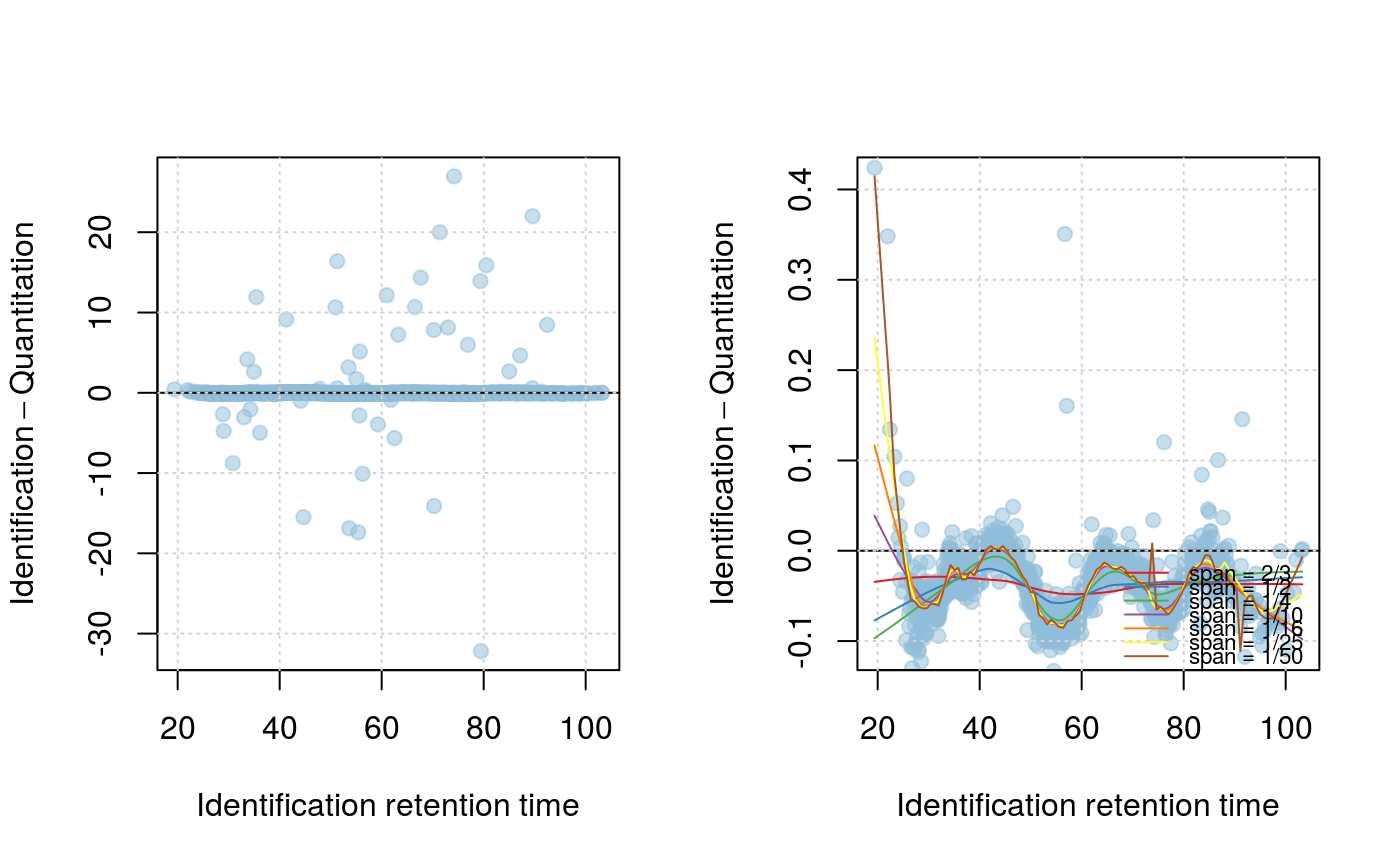
signature(object="Synapter", ...): Plots a histogram of retention time differences after alignments....is passed tohist.- plotRt
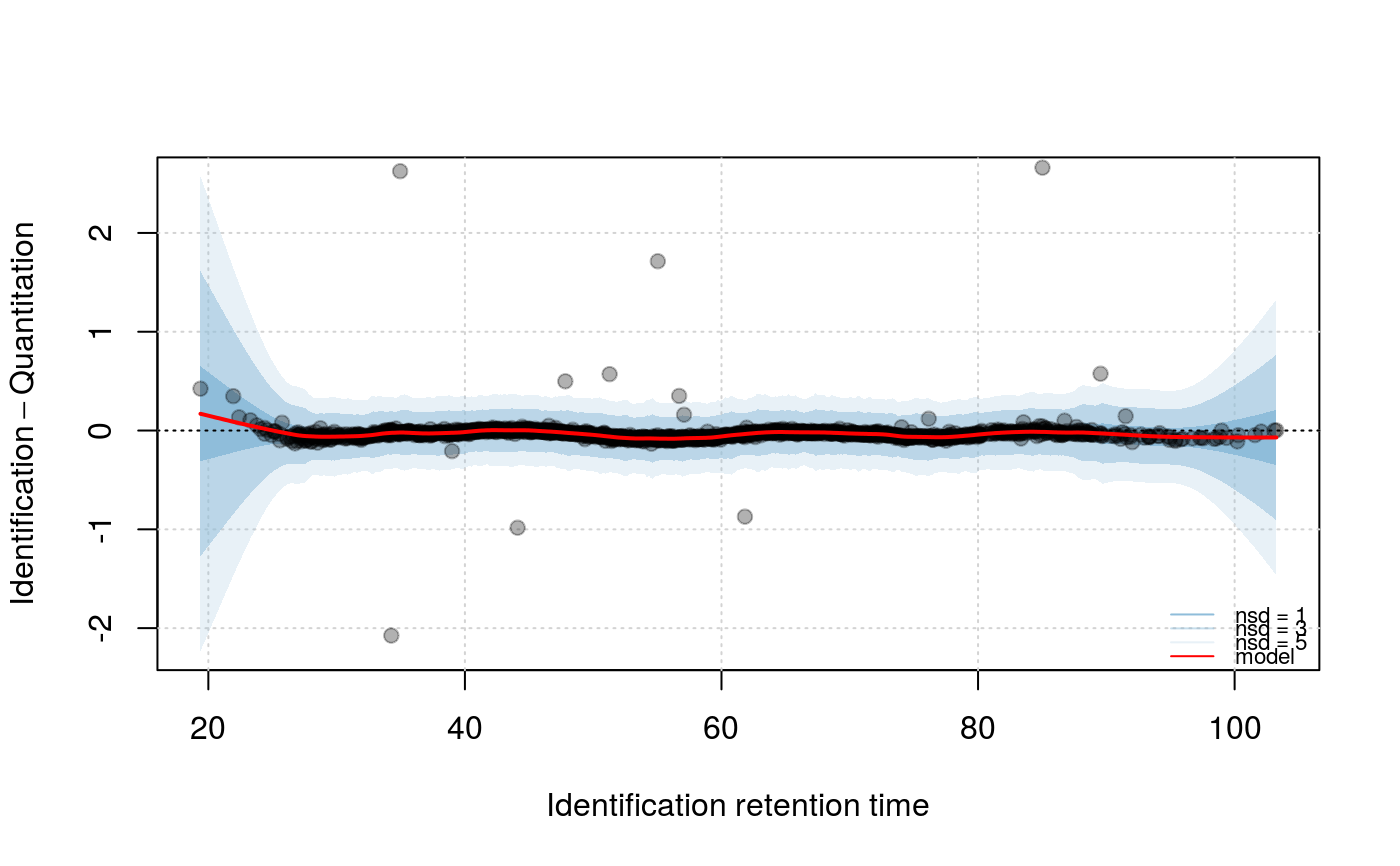
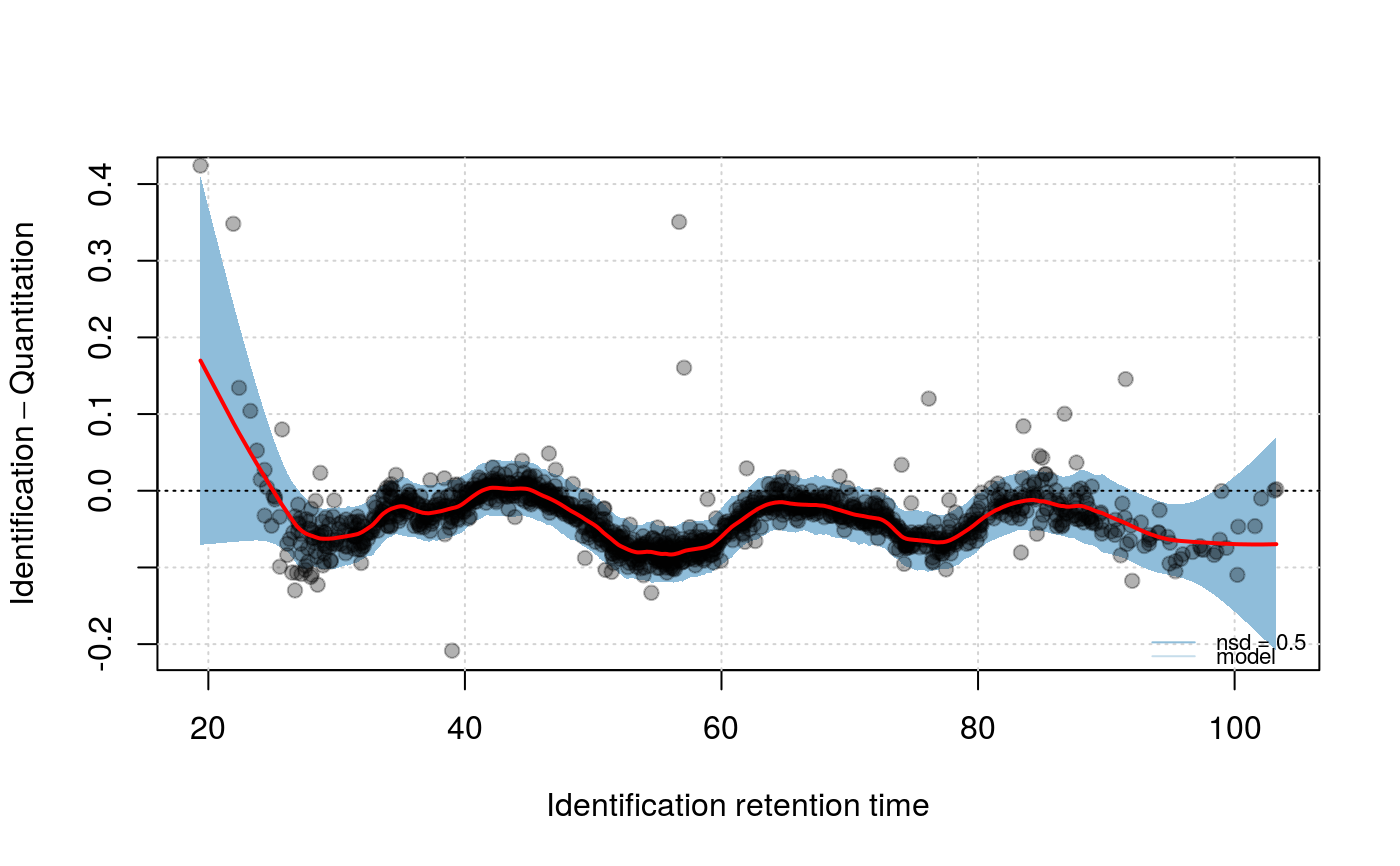
signature(object="Synapter", what =
	  "character", f = "numeric", nsd = "numeric")
: Plots the Identification - Quantitation retention time difference as a function of the Identification retention time. Ifwhatis"data", two plots are generated: one ranging the full range of retention time differences and one focusing on the highest data point density and showing models with variousspanparameter values, as defined byf(default is 2/3, 1/2, 1/4, 1/10, 1/16, 1/25, 1/50, passed as a numed numeric). Ifwhatis"model", a focused plot with the applied span parameter is plotted and areas ofnsd(default isx(1, 3, 5)number of standard deviations are shaded around the model.- plotIntensity
signature(object="Synapter", what =
	  "character", f = "numeric", nsd = "numeric")
: Plots the (log2) ratio of Identification and Quantitation intensities as a function of the Identification retention time. Ifwhatis"data", two plots are generated: one ranging the full range of ratios and one focusing on the highest data point density and showing models with variousspanparameter values, as defined byf(default is 2/3, 1/2, 1/4, 1/10, 1/16, 1/25, 1/50, passed as a numed numeric). Ifwhatis"model", a focused plot with the applied span parameter is plotted and areas ofnsd(default isx(1, 3, 5)number of standard deviations are shaded around the model.- plotPepScores
signature(object="Synapter"): Plots the distribution of random and regular peptide scores for identification and quantitation features. This reflects how peptide p-values are computed. See alsogetPepNumbers.- plotFdr
signature(object="Synapter", method =
	"character")
: Displays 2 plots per identification and quantitation peptides, showing the number of significant peptides as a function of the FDR cut-off and the expected false number of false positive as a number of significant tests. PepFrag 1 and 2 peptides are illustrated on the same figures. These figures are adapted fromplot.qvalue.method, one of"BH","Bonferroni"or"qval", defines what identification statistics to use.- plotEMRTtable
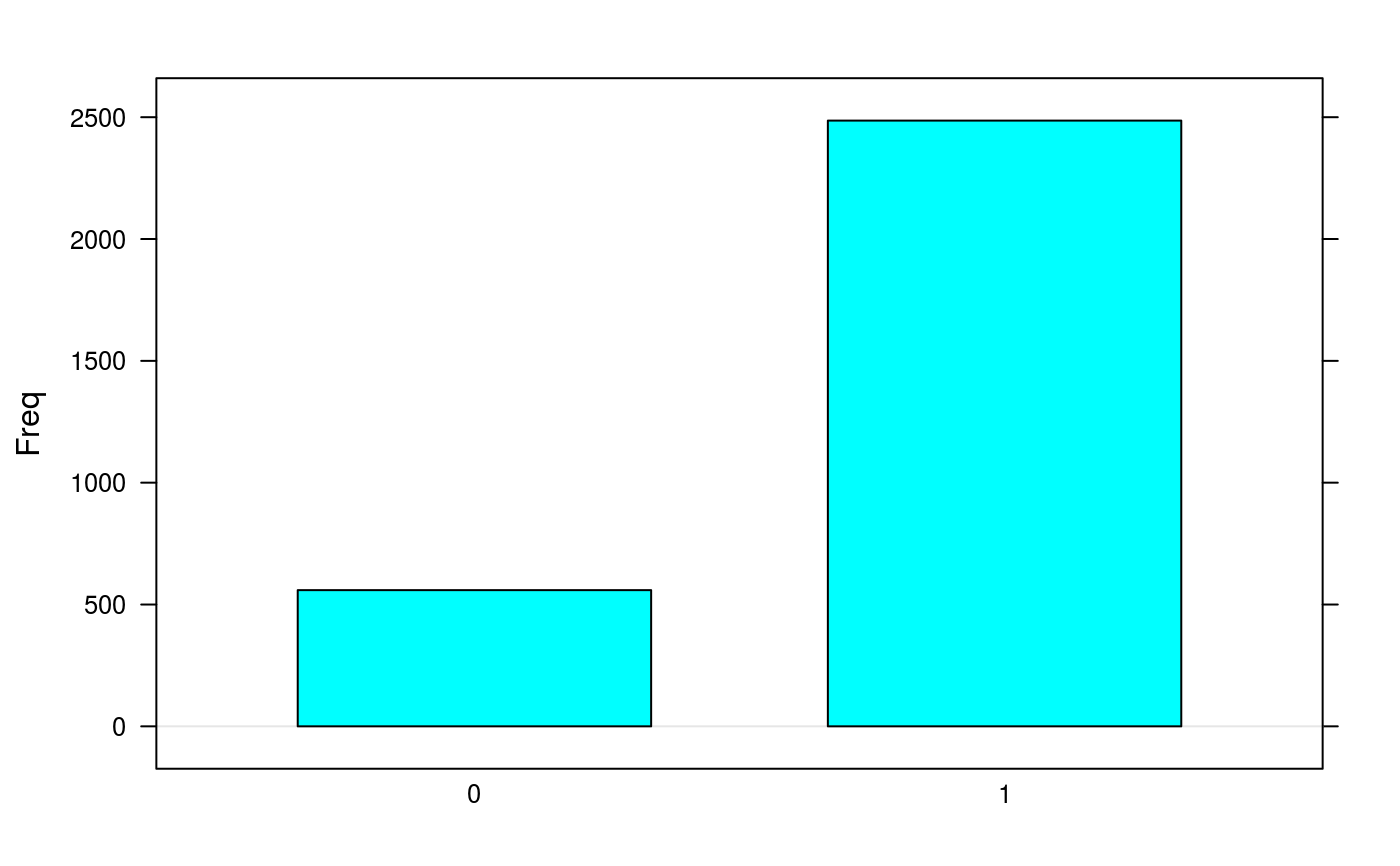
signature(object="Synapter"): Plots the barchart of number or 0, 1, 2, ... assigned EMRTs (seegetEMRTtable) .- plotGrid
signature(object="Synapter", what =
	"character"), maindim = "character"
: Plots a heatmap of the respective grid search results. This grid to be plotted is controlled bywhat:"total","model"or"details"are available. If ion mobility was used in the grid search you can usemaindimto decided which dimensions should be shown.maindimcould be one of"im"(default),"rt"and"mz". Ifmaindim = "im"a heatmap for each ion mobility threshold is drawn. Formaindim = "rt"andmaindimyou get a heatmap for each retention time respective mass threshold.- plotFeatures
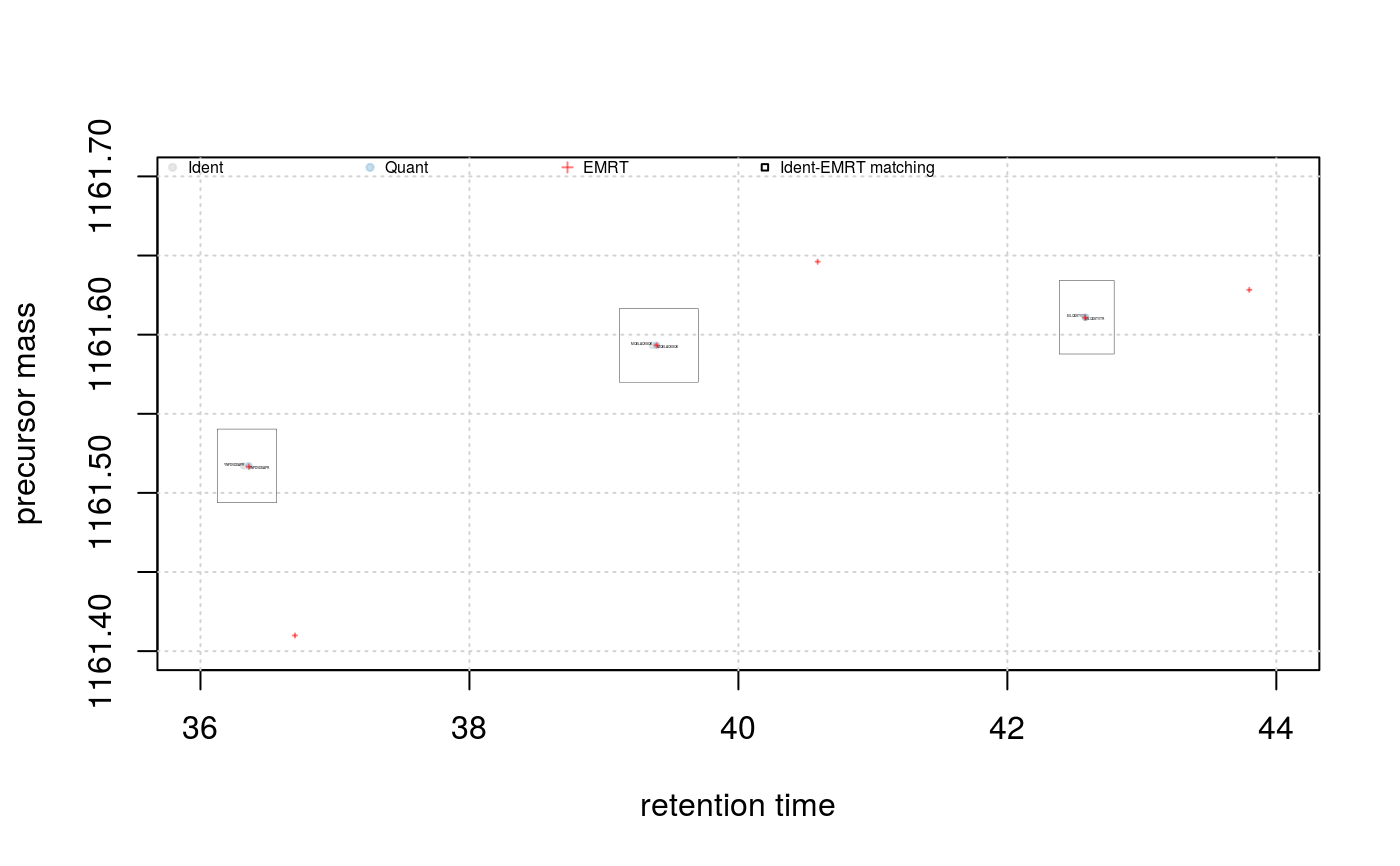
signature(object="Synapter", what =
	"character", xlim = "numeric", ylim = "numeric", ionmobiltiy = "logical")
: Plots the retention time against precursor mass space. Ifwhatis"all", three (six if ion mobility is available andionmobility = TRUE(default isFALSE); three additional plots with precursor mass against ion mobility) such plots are created side by side: for the identification peptides, the quantitation peptides and the quantitation Pep3D data. Ifwhatis"some", a subset of the rt/mass space can be defined withxlim(default isc(40, 60)) andylim(default isc(1160, 1165)) and identification peptide, quantitation peptides and EMRTs are presented on the same graph as grey dots, blue dots and red crosses respectively. In addition, rectangles based on the ppm and nsd defined tolerances (seesetPpmErrorandsetNsdError) are drawn and centered at the expected modelled retention time. This last figure allows to visualise the EMRT matching.- plotFragmentMatching
signature(object = "Synapter",
        key = "character", column = "character",
        verbose = "logical", …)
: Plots two spectra and fragments against each other. Please seeplotFragmentMatchingfor details.- plotFragmentMatchingPerformance
signature(object = "Synapter",
        showAllPeptides = FALSE)
: Creates two plots. The left panel shows the performance of filtering the unique matches of the merged peptides using a different number of common peaks. The right panel shows the performance of filtering the non unique matches of the merged peptides using different differences (delta) in common peaks/fragments. These differences (delta) are calculated between the match with the highest number of common peaks/fragments and the second highest one. UsefilterUniqueMatchesandfilterNonUniqueMatchesto filter theMatchedEMRTdata.frameusing one of these thresholds. This function returns alistwith two named elements (unqiueandnonunqiueinvisibly. These are the same data as return byfragmentMatchingPerformance. UseshowAllPeptides=TRUEto add a line for all peptides (not just the merged onces) to both plots.- plotCumulativeNumberOfFragments
signature(object = "Synapter",
        what = c("fragments.ident", "spectra.quant"))
: Plots the cumulative number of the fragments/peaks vs their intensity (log10 scaled). Use thewhatargument to create this plot for the identification fragments (what = "fragments.quant") or the the quantitation spectra (what = "spectra.quant").
Exporters
- writeMergedPeptides
signature(object="Synapter", file
	  = "character", what = "character", ...)
: Exports the merged peptide data to a comma-separatedfile(default name is"Res-MergedPeptides.csv").- writeMatchedEMRTs
signature(object="Synapter", file =
	  "character", …)
: As above, saving the matched EMRT table.- writeIdentPeptides
signature(object="Synapter", file
	  = "character", …)
: As above, exporting the identification peptide data.- writeQuantPeptides
signature(object="Synapter", file
	  = "character", …)
: A above, exporting the quantitation peptide data.- getIdentificationFragments
signature(object="Synapter"): returns the identification fragments asMSnExp.- getQuantitationSpectra
signature(object="Synapter"): returns the quantitation spectra asMSnExp.
Other
- as(, "MSnSet")
signature(x = "Synapter"): Coerce object fromSynaptertoMSnSetclass.
- validObject
signature(object = "Synapter"): Test whether a givenSynapterobject is valid.
- updateObject
signature(object = "Synapter"): Updates an oldSynapterobject.
References
Käll L, Storey JD, MacCoss MJ, Noble WS Posterior error probabilities and false discovery rates: two sides of the same coin. J Proteome Res. 2008a Jan; 7:(1)40-4
Bonferroni single-step adjusted p-values for strong control of the FWER.
Benjamini Y. and Hochberg Y. Controlling the false discovery rate: a practical and powerful approach to multiple testing. J. R. Statist. Soc. B., 1995, Vol. 57: 289-300.
Storey JD and Tibshirani R. Statistical significance for genome-wide experiments. Proceedings of the National Academy of Sciences, 2003, 100: 9440-9445.
Käll, Storey JD, MacCoss MJ, Noble WS Assigning significance to peptides identified by tandem mass spectrometry using decoy databases. J Proteome Res. 2008b Jan; 7:(1)29-34
Improving qualitative and quantitative performance for MSE-based label free proteomics, N.J. Bond, P.V. Shliaha, K.S. Lilley and L. Gatto, Journal of Proteome Research, 2013, in press.
The Effects of Travelling Wave Ion Mobility Separation on Data Independent Acquisition in Proteomics Studies, P.V. Shliaha, N.J. Bond, L. Gatto and K.S. Lilley, Journal of Proteome Research, 2013, in press.
Trypsin cleavage:
Glatter, Timo, et al. Large-scale quantitative assessment of different in-solution protein digestion protocols reveals superior cleavage efficiency of tandem Lys-C/trypsin proteolysis over trypsin digestion. Journal of proteome research 11.11 (2012): 5145-5156. http://dx.doi.org/10.1021/pr300273g
Rodriguez, Jesse, et al. Does trypsin cut before proline?. Journal of proteome research 7.01 (2007): 300-305. http://dx.doi.org/10.1021/pr0705035
Brownridge, Philip, and Robert J. Beynon. The importance of the digest: proteolysis and absolute quantification in proteomics. Methods 54.4 (2011): 351-360. http://dx.doi.org/10.1016/j.ymeth.2011.05.005
cleaver's rules are taken from: http://web.expasy.org/peptide_cutter/peptidecutter_enzymes.html#Tryps
Examples
library(synapter) ## always needed# NOT RUN { ## (1) Construction - to create your own data objects synapterTiny <- Synapter() # }## let's use synapterTiny, shipped with the package synapterTinyData() ## loads/prepares the data synapterTiny ## show object#> Object of class "Synapter" #> Class version 2.0.0 #> Package version 1.99.0 #> Data files: #> + Identification pep file: 01_HDMSe_tiny.csv #> + Quantitation pep file: 02_MSe_tiny.csv #> + Quantitation Pep3DAMRT file: 03_Pep3D_tiny.csv #> + Fasta file: 04_test_database.fasta #> Log: #> [1] "Instance created on Wed Jun 6 23:37:36 2012" #> [2] "Read identification peptide data [5915,18]" #> [ 9 lines ] #> [12] "Filtered identification Random entries [4979,22]" #> [13] "Instance updated to synapter 1.99.0 on Sun Oct 16 16:47:24 2016"## (2) Filtering ## (2.1) Peptide scores and FDR ## visualise/explore peptide id scores plotPepScores(synapterTiny)getPepNumbers(synapterTiny)#> PepFrag1.Random PepFrag1.Regular PepFrag2.Random PepFrag2.Regular #> ident 256 3522 448 1393 #> quant 496 2664 500 745## filter data filterUniqueDbPeptides(synapterTiny) ## keeps unique proteotypic peptides filterPeptideLength(synapterTiny, l = 7) ## default length is 7 ## visualise before FDR filtering plotFdr(synapterTiny)setPepScoreFdr(synapterTiny, fdr = 0.01) ## optional filterQuantPepScore(synapterTiny, fdr = 0.01) ## specifying FDR filterIdentPepScore(synapterTiny) ## FDR not specified, using previously set value ## (2.2) Mass tolerance getPpmErrorQs(synapterTiny)#> 25% 50% 75% 90% 91% 92% 93% 94% 95% 96% 97% #> Ident 0.982 2.183 4.070 6.750 7.663 8.299 9.136 9.989 12.060 13.997 16.082 #> Quant 0.432 0.972 1.682 3.083 3.341 3.606 3.992 5.021 5.733 6.455 7.736 #> 98% 99% 100% #> Ident 19.288 22.496 28.664 #> Quant 9.124 14.897 24.599plotPpmError(synapterTiny, what="Ident")plotPpmError(synapterTiny, what="Quant")setIdentPpmError(synapterTiny, ppm = 20) ## optional filterQuantPpmError(synapterTiny, ppm = 20) ## setQuantPpmError(synapterTiny, ppm = 20) ## set quant ppm threshold below filterIdentPpmError(synapterTiny, ppm=20) filterIdentProtFpr(synapterTiny, fpr = 0.01) filterQuantProtFpr(synapterTiny, fpr = 0.01) getPpmErrorQs(synapterTiny) ## to be compared with previous output#> 25% 50% 75% 90% 91% 92% 93% 94% 95% 96% 97% #> Ident 0.968 2.144 3.939 6.233 6.589 7.035 7.942 8.775 9.523 10.688 12.643 #> Quant 0.431 0.964 1.661 2.973 3.137 3.386 3.702 4.214 5.211 6.095 7.117 #> 98% 99% 100% #> Ident 14.563 17.007 19.744 #> Quant 8.289 9.558 19.817## (3) Merge peptide sequences mergePeptides(synapterTiny) ## (4) Retention time modelling plotRt(synapterTiny, what="data")setLowessSpan(synapterTiny, 0.05) modelRt(synapterTiny) ## the actual modelling getRtQs(synapterTiny)#> 25% 50% 75% 90% 91% 92% 93% 94% 95% 96% 97% #> 0.003 0.008 0.016 0.029 0.031 0.034 0.040 0.047 0.057 0.072 0.463 #> 98% 99% 100% #> 4.161 10.703 32.140plotRtDiffs(synapterTiny)## plotRtDiffs(synapterTiny, xlim=c(-1, 1), breaks=500) ## pass parameters to hist() plotRt(synapterTiny, what="model") ## using default nsd 1, 3, 5plotRt(synapterTiny, what="model", nsd=0.5) ## better focus on modelplotFeatures(synapterTiny, what="all")setRtNsd(synapterTiny, 3) ## RtNsd and PpmError are used for detailed plot setPpmError(synapterTiny, 10) ## if not set manually, default values are set automatically plotFeatures(synapterTiny, what="some", xlim=c(36,44), ylim=c(1161.4, 1161.7))## best plotting to svg for zooming set.seed(1) ## only for reproducibility of this example ## (5) Grid search to optimise EMRT matching parameters searchGrid(synapterTiny, ppms = 7:10, ## default values are 5, 7, ..., 20 nsds = 1:3, ## default values are 0.5, 1, ..., 5 subset = 0.2) ## default is 1 ## alternatively, use 'n = 1000' to use exactly ## 1000 randomly selected features for the grid search getGrid(synapterTiny) ## print the grid#> $prcntTotal #> , , Inf #> #> 7 8 9 10 #> 1 0.747 0.755 0.760 0.760 #> 2 0.824 0.833 0.839 0.839 #> 3 0.824 0.833 0.839 0.839 #> #> #> $prcntModel #> , , Inf #> #> 7 8 9 10 #> 1 0.872 0.872 0.872 0.872 #> 2 0.972 0.972 0.972 0.972 #> 3 0.972 0.972 0.972 0.972 #> #> #> $details #> , , Inf #> #> 7 8 9 10 #> 1 0.984 0.984 0.984 0.984 #> 2 0.986 0.986 0.986 0.986 #> 3 0.986 0.986 0.986 0.986 #> #>getGridDetails(synapterTiny) ## grid details#> $`1:7:Inf` #> -2 -1 0 1 2 #> 0 4 33 251 0 #> #> $`1:8:Inf` #> -2 -1 0 1 2 #> 0 4 33 251 0 #> #> $`1:9:Inf` #> -2 -1 0 1 2 #> 0 4 33 251 0 #> #> $`1:10:Inf` #> -2 -1 0 1 2 #> 0 4 33 251 0 #> #> $`2:7:Inf` #> -2 -1 0 1 2 #> 0 4 4 280 0 #> #> $`2:8:Inf` #> -2 -1 0 1 2 #> 0 4 4 280 0 #> #> $`2:9:Inf` #> -2 -1 0 1 2 #> 0 4 4 280 0 #> #> $`2:10:Inf` #> -2 -1 0 1 2 #> 0 4 4 280 0 #> #> $`3:7:Inf` #> -2 -1 0 1 2 #> 0 4 4 280 0 #> #> $`3:8:Inf` #> -2 -1 0 1 2 #> 0 4 4 280 0 #> #> $`3:9:Inf` #> -2 -1 0 1 2 #> 0 4 4 280 0 #> #> $`3:10:Inf` #> -2 -1 0 1 2 #> 0 4 4 280 0 #>plotGrid(synapterTiny, what = "total") ## plot the grid for total matchingplotGrid(synapterTiny, what = "model") ## plot the grid for matched modelled featureplotGrid(synapterTiny, what = "details") ## plot the detail gridgetBestGridValue(synapterTiny) ## return best grid values#> prcntTotal prcntModel details #> 0.8390805 0.9722222 0.9859155getBestGridParams(synapterTiny) ## return parameters corresponding to best values#> $prcntTotal #> nsd ppm imdiff #> [1,] 2 9 Inf #> [2,] 3 9 Inf #> [3,] 2 10 Inf #> [4,] 3 10 Inf #> #> $prcntModel #> nsd ppm imdiff #> [1,] 2 7 Inf #> [2,] 3 7 Inf #> [3,] 2 8 Inf #> [4,] 3 8 Inf #> [5,] 2 9 Inf #> [6,] 3 9 Inf #> [7,] 2 10 Inf #> [8,] 3 10 Inf #> #> $details #> nsd ppm imdiff #> [1,] 2 7 Inf #> [2,] 3 7 Inf #> [3,] 2 8 Inf #> [4,] 3 8 Inf #> [5,] 2 9 Inf #> [6,] 3 9 Inf #> [7,] 2 10 Inf #> [8,] 3 10 Inf #>setBestGridParams(synapterTiny, what = "auto") ## sets RtNsd and PpmError according the grid results ## 'what' could also be "model", "total" or "details" ## setPpmError(synapterTiny, 12) ## to manually set values ## setRtNsd(synapterTiny, 2.5) ## (6) Matching ident peptides and quant EMRTs findEMRTs(synapterTiny) plotEMRTtable(synapterTiny)getEMRTtable(synapterTiny)#> #> 0 1 #> 559 2486performance(synapterTiny) performance2(synapterTiny) ## (7) Exporting data to csv spreadsheets writeMergedPeptides(synapterTiny) writeMergedPeptides(synapterTiny, file = "myresults.csv") writeMatchedEMRTs(synapterTiny) writeMatchedEMRTs(synapterTiny, file = "myresults2.csv") ## These will export the filter peptide data writeIdentPeptides(synapterTiny, file = "myIdentPeptides.csv") writeQuantPeptides(synapterTiny, file = "myQuantPeptides.csv") ## If used right after loading, the non-filted data will be exported