Classification using the support vector machine algorithm.
Usage
svmClassification(
  object,
  assessRes,
  scores = c("prediction", "all", "none"),
  cost,
  sigma,
  fcol = "markers",
  ...
)
Arguments
- object
An instance of class
"MSnSet".- assessRes
An instance of class
"GenRegRes", as generated bysvmOptimisation.- scores
One of
"prediction","all"or"none"to report the score for the predicted class only, for all classes or none.- cost
If
assessResis missing, acostmust be provided.- sigma
If
assessResis missing, asigmamust be provided.- fcol
The feature meta-data containing marker definitions. Default is
markers.- ...
Additional parameters passed to
svmfrom packagee1071.
Value
An instance of class "MSnSet" with
svm and svm.scores feature variables storing the
classification results and scores respectively.
Examples
library(pRolocdata)
data(dunkley2006)
## reducing parameter search space and iterations
params <- svmOptimisation(dunkley2006, cost = 2^seq(-2,2,2), sigma = 10^seq(-1, 1, 1),  times = 3)
#>
  |
  |                                                                      |   0%
  |
  |=====                                                                 |   7%
  |
  |=========                                                             |  13%
  |
  |==============                                                        |  20%
  |
  |===================                                                   |  27%
  |
  |=======================                                               |  33%
  |
  |============================                                          |  40%
  |
  |=================================                                     |  47%
  |
  |=====================================                                 |  53%
  |
  |==========================================                            |  60%
  |
  |===============================================                       |  67%
  |
  |===================================================                   |  73%
  |
  |========================================================              |  80%
  |
  |=============================================================         |  87%
  |
  |=================================================================     |  93%
  |
  |======================================================================| 100%
params
#> Object of class "GenRegRes"
#> Algorithm: svm
#> Hyper-parameters:
#>  cost: 0.25 1 4
#>  sigma: 0.1 1 10
#> Design:
#>  Replication: 3 x 5-fold X-validation
#>  Partitioning: 0.2/0.8 (test/train)
#> Results
#>  macro F1:
#>    Min. 1st Qu.  Median    Mean 3rd Qu.    Max.
#>  0.9740  0.9762  0.9783  0.9841  0.9891  1.0000
#>  best sigma: 0.1
#>  best cost: 4 1
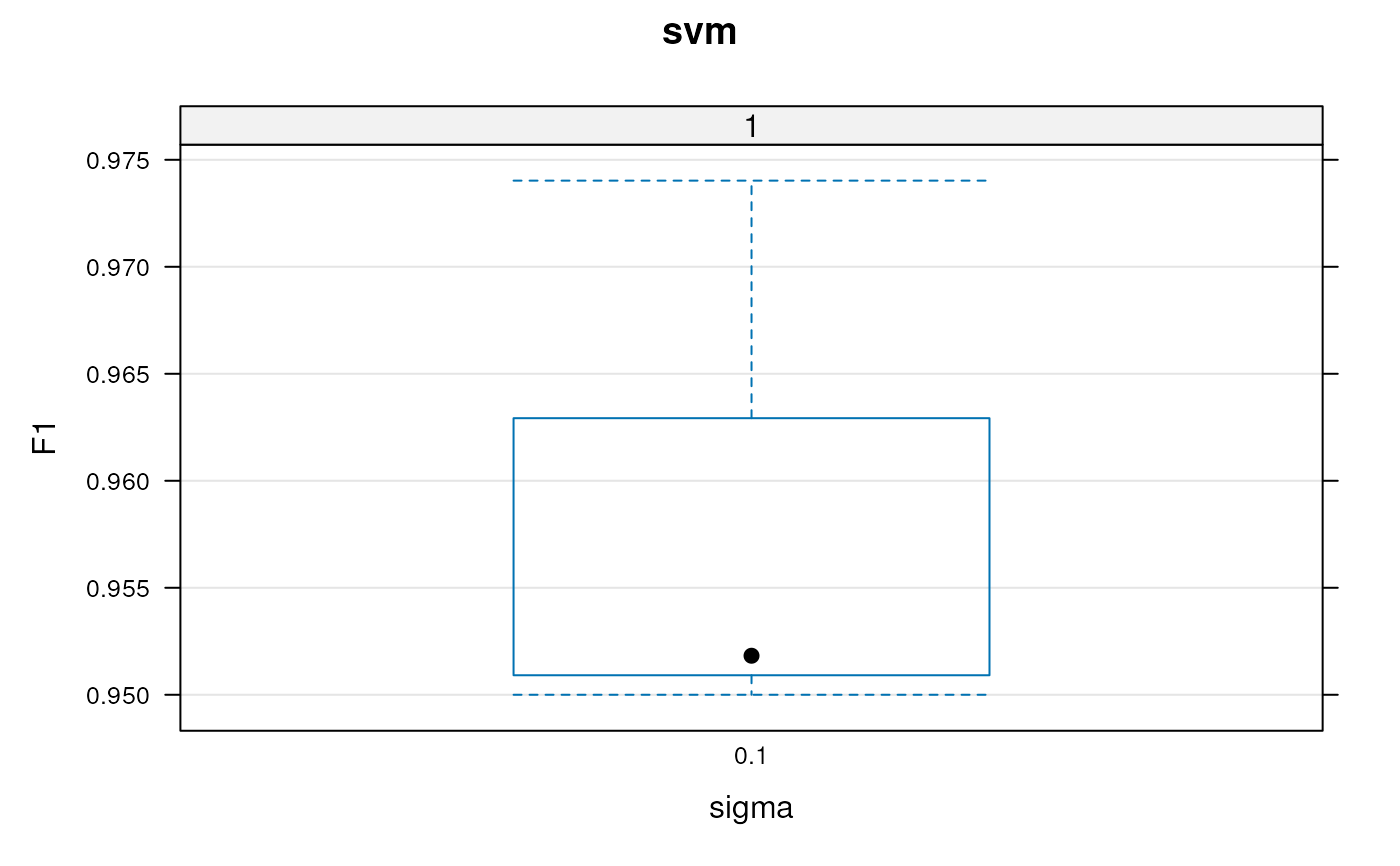
plot(params)

f1Count(params)
#>     1 4
#> 0.1 1 0
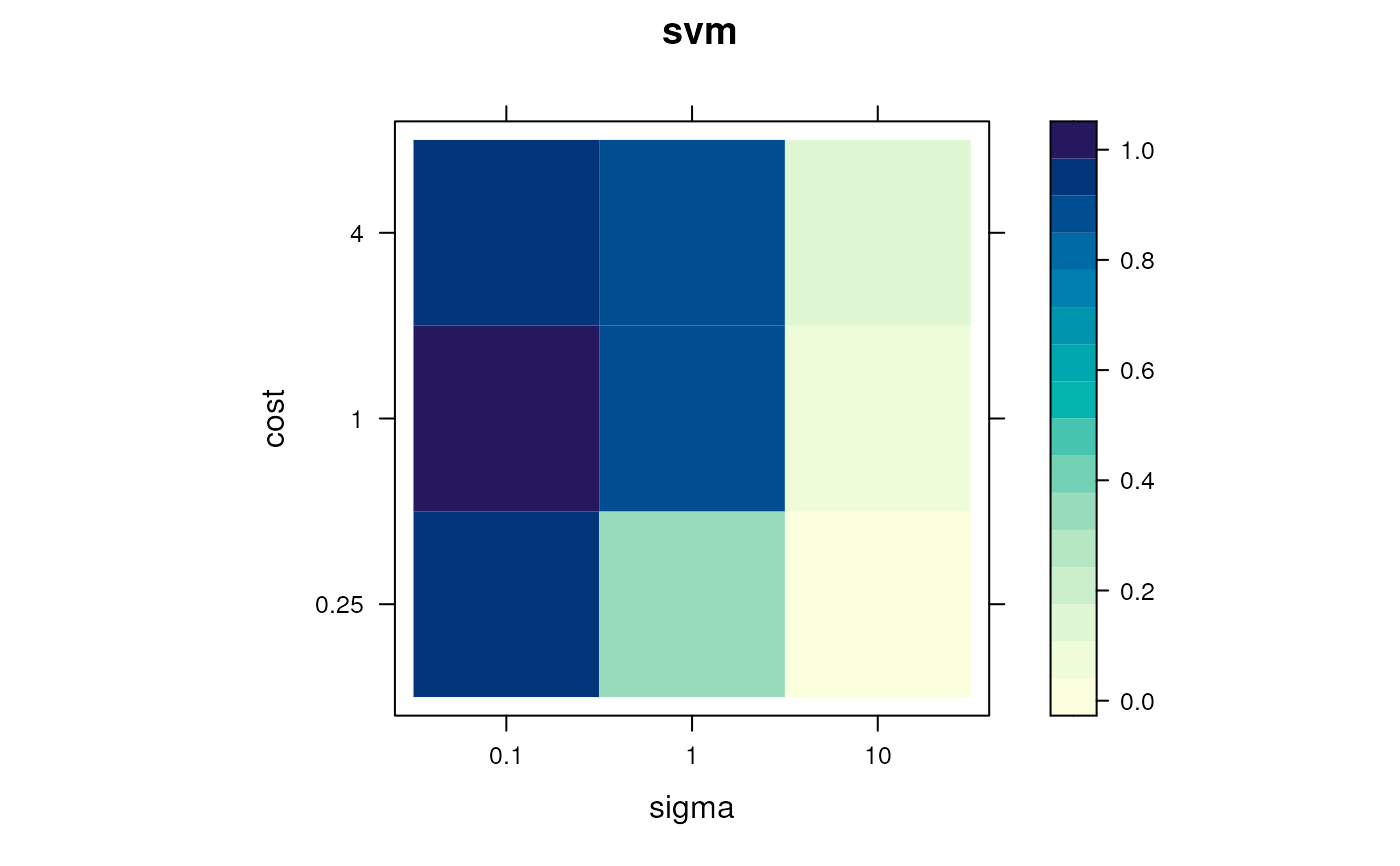
levelPlot(params)

getParams(params)
#> sigma  cost
#>   0.1   1.0
res <- svmClassification(dunkley2006, params)
#> [1] "markers"
getPredictions(res, fcol = "svm")
#> ans
#>      ER lumen   ER membrane         Golgi Mitochondrion            PM
#>            16           177            99           102           136
#>       Plastid      Ribosome           TGN       vacuole
#>            52            54            18            35
#> MSnSet (storageMode: lockedEnvironment)
#> assayData: 689 features, 16 samples
#>   element names: exprs
#> protocolData: none
#> phenoData
#>   sampleNames: M1F1A M1F4A ... M2F11B (16 total)
#>   varLabels: membrane.prep fraction replicate
#>   varMetadata: labelDescription
#> featureData
#>   featureNames: AT1G09210 AT1G21750 ... AT4G39080 (689 total)
#>   fvarLabels: assigned evidence ... svm.pred (11 total)
#>   fvarMetadata: labelDescription
#> experimentData: use 'experimentData(object)'
#>   pubMedIds: 16618929
#> Annotation:
#> - - - Processing information - - -
#> Loaded on Thu Jul 16 22:53:08 2015.
#> Normalised to sum of intensities.
#> Added markers from  'mrk' marker vector. Thu Jul 16 22:53:08 2015
#> Performed svm prediction (sigma=0.1 cost=1) Sat Nov 23 16:04:53 2024
#> Added svm predictions according to global threshold = 0 Sat Nov 23 16:04:53 2024
#>  MSnbase version: 1.17.12
getPredictions(res, fcol = "svm", t = 0.75)
#> ans
#>      ER lumen   ER membrane         Golgi Mitochondrion            PM
#>            14           147            70            93           109
#>       Plastid      Ribosome           TGN       unknown       vacuole
#>            44            27            13           144            28
#> MSnSet (storageMode: lockedEnvironment)
#> assayData: 689 features, 16 samples
#>   element names: exprs
#> protocolData: none
#> phenoData
#>   sampleNames: M1F1A M1F4A ... M2F11B (16 total)
#>   varLabels: membrane.prep fraction replicate
#>   varMetadata: labelDescription
#> featureData
#>   featureNames: AT1G09210 AT1G21750 ... AT4G39080 (689 total)
#>   fvarLabels: assigned evidence ... svm.pred (11 total)
#>   fvarMetadata: labelDescription
#> experimentData: use 'experimentData(object)'
#>   pubMedIds: 16618929
#> Annotation:
#> - - - Processing information - - -
#> Loaded on Thu Jul 16 22:53:08 2015.
#> Normalised to sum of intensities.
#> Added markers from  'mrk' marker vector. Thu Jul 16 22:53:08 2015
#> Performed svm prediction (sigma=0.1 cost=1) Sat Nov 23 16:04:53 2024
#> Added svm predictions according to global threshold = 0.75 Sat Nov 23 16:04:53 2024
#>  MSnbase version: 1.17.12
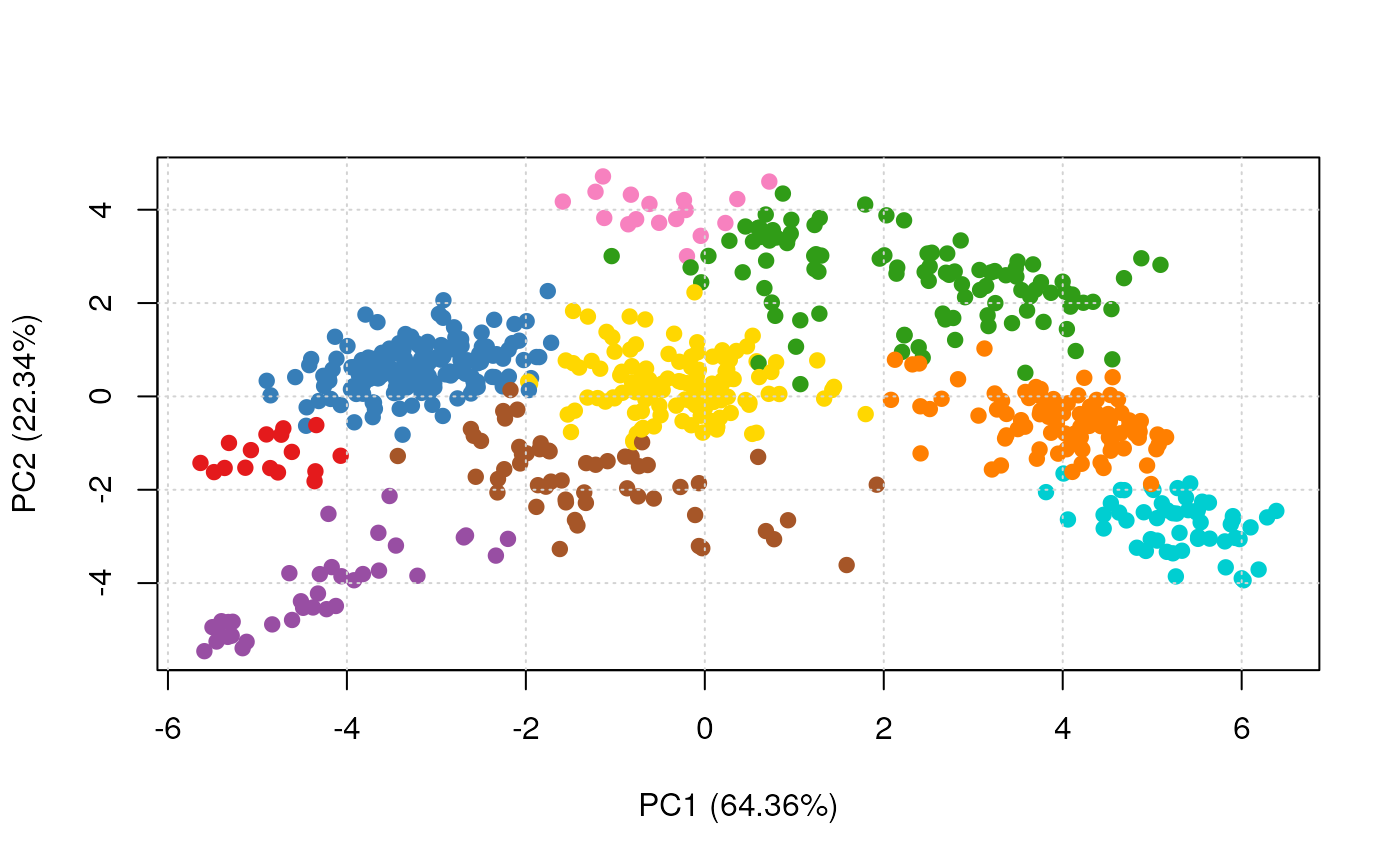
plot2D(res, fcol = "svm")
